
Cigna (CI)
Cigna piques our interest. Its scale gives it meaningful leverage when negotiating reimbursement rates.― StockStory Analyst Team
1. News


2. Summary
Why Cigna Is Interesting
With roots dating back to 1792 and serving millions of customers across the globe, The Cigna Group (NYSE:CI) provides healthcare services through its Evernorth Health Services and Cigna Healthcare segments, offering pharmacy benefits, specialty care, and medical plans.
- Enormous revenue base of $255.3 billion gives it leverage over plan holders and advantageous reimbursement terms with healthcare providers
- Earnings per share have comfortably outperformed the peer group average over the last five years, increasing by 9.1% annually
- One risk is its projected sales are flat for the next 12 months, implying demand will slow from its two-year trend


Cigna shows some promise. If you like the story, the valuation seems fair.
Why Is Now The Time To Buy Cigna?


Cigna’s stock price of $317 implies a valuation ratio of 10.3x forward P/E. Many healthcare companies feature higher valuation multiples than Cigna. Regardless, we think Cigna’s current price is appropriate given the quality you get.
If you think the market is not giving the company enough credit for its fundamentals, now could be a good time to invest.
3. Cigna (CI) Research Report: Q1 CY2025 Update
Health insurance company Cigna (NYSE:CI) announced better-than-expected revenue in Q1 CY2025, with sales up 14.4% year on year to $65.5 billion. Its non-GAAP profit of $6.74 per share was 6.2% above analysts’ consensus estimates.
Cigna (CI) Q1 CY2025 Highlights:
- Revenue: $65.5 billion vs analyst estimates of $60.42 billion (14.4% year-on-year growth, 8.4% beat)
- Adjusted EPS: $6.74 vs analyst estimates of $6.35 (6.2% beat)
- Operating Margin: 2.8%, down from 3.9% in the same quarter last year
- Customers: 18.04 million, up from 17.5 million in the previous quarter
- Market Capitalization: $90.87 billion
Company Overview
With roots dating back to 1792 and serving millions of customers across the globe, The Cigna Group (NYSE:CI) provides healthcare services through its Evernorth Health Services and Cigna Healthcare segments, offering pharmacy benefits, specialty care, and medical plans.
The Cigna Group operates through two main segments. Evernorth Health Services partners with health plans, employers, government organizations, and healthcare providers to deliver pharmacy benefits management, specialty pharmacy services, and care solutions. This segment includes Express Scripts, one of the largest pharmacy benefits managers in the U.S., and Accredo, a specialty pharmacy focused on complex and rare diseases.
The Cigna Healthcare segment provides medical insurance and administrative services to employers, individuals, and government programs. It offers a range of funding arrangements from fully-insured to administrative services only (ASO) plans where employers self-fund healthcare costs. The segment also includes specialty benefits like dental, behavioral health, and pharmacy management solutions.
A typical employer client might use Cigna's ASO services to administer their self-funded health plan while also accessing Evernorth's pharmacy benefits management to control prescription costs. Meanwhile, an individual with a complex condition might receive specialty medications through Accredo while being supported by care management programs.
The company generates revenue through various streams: administrative fees from self-funded clients, insurance premiums from fully-insured customers, and pharmacy-related revenues. For Medicare Advantage plans, Cigna receives payments from the Centers for Medicare and Medicaid Services (CMS) based on customer demographics and health risk factors.
Cigna emphasizes value-based care arrangements with healthcare providers, moving away from traditional fee-for-service models toward payment structures that reward quality outcomes and cost efficiency. The company has over 200 collaborative care arrangements with primary care groups and contracts with more than 200 hospital systems involving quality-based reimbursements.
4. Health Insurance Providers
Upfront premiums collected by health insurers lead to reliable revenue, but profitability ultimately depends on accurate risk assessments and the ability to control medical costs. Health insurers are also highly sensitive to regulatory changes and economic conditions such as unemployment. Going forward, the industry faces tailwinds from an aging population, increasing demand for personalized healthcare services, and advancements in data analytics to improve cost management. However, continued regulatory scrutiny on pricing practices, the potential for government-led reforms such as expanded public healthcare options, and inflation in medical costs could add volatility to margins. One big debate among investors is the long-term impact of AI and whether it will help underwriting, fraud detection, and claims processing or whether it may wade into ethical grey areas like reinforcing biases and widening disparities in medical care.
The Cigna Group competes with other major health insurers and pharmacy benefit managers including UnitedHealth Group (NYSE:UNH), CVS Health/Aetna (NYSE:CVS), Humana (NYSE:HUM), Anthem/Elevance Health (NYSE:ELV), and Centene Corporation (NYSE:CNC). In the pharmacy benefits management space, specific competitors include CVS Caremark and OptumRx (part of UnitedHealth Group).
5. Economies of Scale
Larger companies benefit from economies of scale, where fixed costs like infrastructure, technology, and administration are spread over a higher volume of goods or services, reducing the cost per unit. Scale can also lead to bargaining power with suppliers, greater brand recognition, and more investment firepower. A virtuous cycle can ensue if a scaled company plays its cards right.
With $255.3 billion in revenue over the past 12 months, Cigna is one of the most scaled enterprises in healthcare. This is particularly important because health insurance providers companies are volume-driven businesses due to their low margins.
6. Sales Growth
A company’s long-term performance is an indicator of its overall quality. Even a bad business can shine for one or two quarters, but a top-tier one grows for years. Luckily, Cigna’s sales grew at a decent 12% compounded annual growth rate over the last five years. Its growth was slightly above the average healthcare company and shows its offerings resonate with customers.
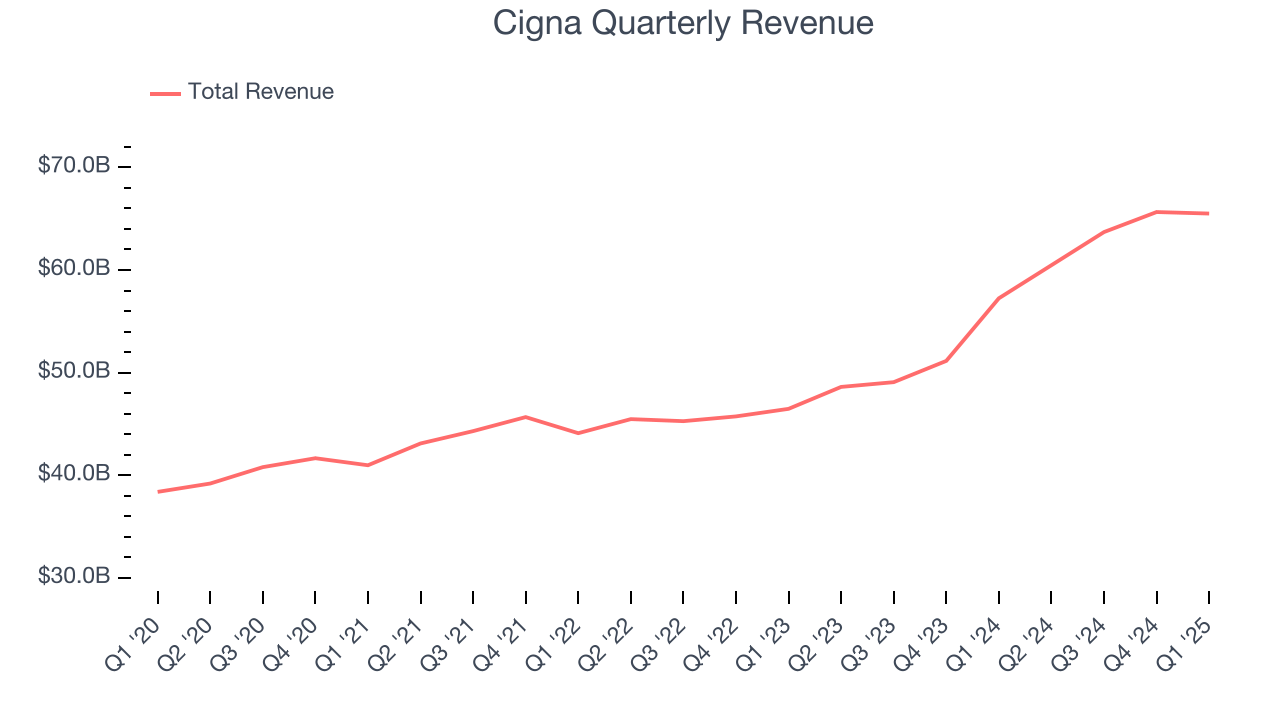
We at StockStory place the most emphasis on long-term growth, but within healthcare, a half-decade historical view may miss recent innovations or disruptive industry trends. Cigna’s annualized revenue growth of 18.1% over the last two years is above its five-year trend, suggesting its demand recently accelerated. 
We can dig further into the company’s revenue dynamics by analyzing its number of customers, which reached 18.04 million in the latest quarter. Over the last two years, Cigna’s customer base averaged 3.3% year-on-year growth. Because this number is lower than its revenue growth, we can see the average customer spent more money each year on the company’s products and services. 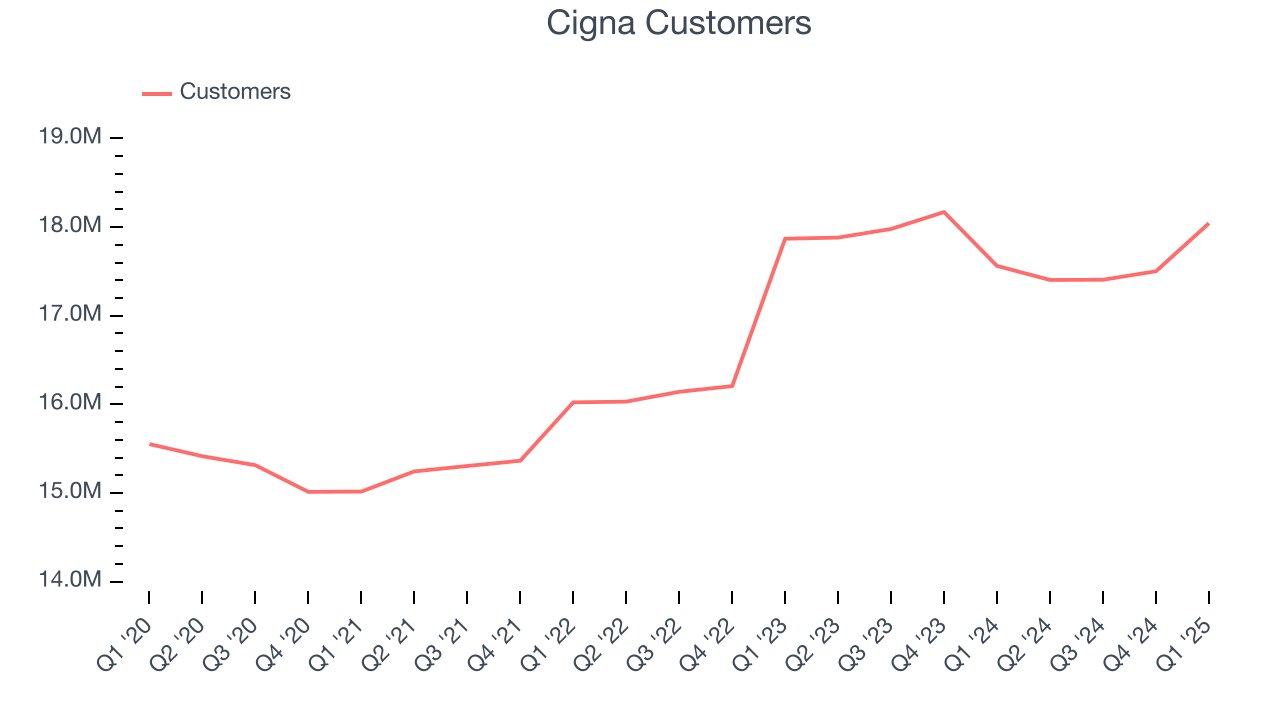
This quarter, Cigna reported year-on-year revenue growth of 14.4%, and its $65.5 billion of revenue exceeded Wall Street’s estimates by 8.4%.
Looking ahead, sell-side analysts expect revenue to remain flat over the next 12 months, a deceleration versus the last two years. This projection is underwhelming and indicates its products and services will see some demand headwinds. At least the company is tracking well in other measures of financial health.
7. Operating Margin
Operating margin is an important measure of profitability as it shows the portion of revenue left after accounting for all core expenses – everything from the cost of goods sold to advertising and wages. It’s also useful for comparing profitability across companies with different levels of debt and tax rates because it excludes interest and taxes.
Cigna was profitable over the last five years but held back by its large cost base. Its average operating margin of 4.3% was weak for a healthcare business.
Looking at the trend in its profitability, Cigna’s operating margin decreased by 1.4 percentage points over the last five years. A silver lining is that on a two-year basis, its margin has stabilized. We like Cigna and hope it can right the ship.

This quarter, Cigna generated an operating profit margin of 2.8%, down 1.1 percentage points year on year. This reduction is quite minuscule and indicates the company’s overall cost structure has been relatively stable.
8. Earnings Per Share
Revenue trends explain a company’s historical growth, but the long-term change in earnings per share (EPS) points to the profitability of that growth – for example, a company could inflate its sales through excessive spending on advertising and promotions.
Cigna’s EPS grew at a remarkable 9.1% compounded annual growth rate over the last five years. However, this performance was lower than its 12% annualized revenue growth, telling us the company became less profitable on a per-share basis as it expanded due to non-fundamental factors such as interest expenses and taxes.

Diving into the nuances of Cigna’s earnings can give us a better understanding of its performance. As we mentioned earlier, Cigna’s operating margin declined by 1.4 percentage points over the last five years. This was the most relevant factor (aside from the revenue impact) behind its lower earnings; taxes and interest expenses can also affect EPS but don’t tell us as much about a company’s fundamentals.
In Q1, Cigna reported EPS at $6.74, up from $6.47 in the same quarter last year. This print beat analysts’ estimates by 6.2%. Over the next 12 months, Wall Street expects Cigna’s full-year EPS of $27.61 to grow 11.1%.
9. Cash Is King
Although earnings are undoubtedly valuable for assessing company performance, we believe cash is king because you can’t use accounting profits to pay the bills.
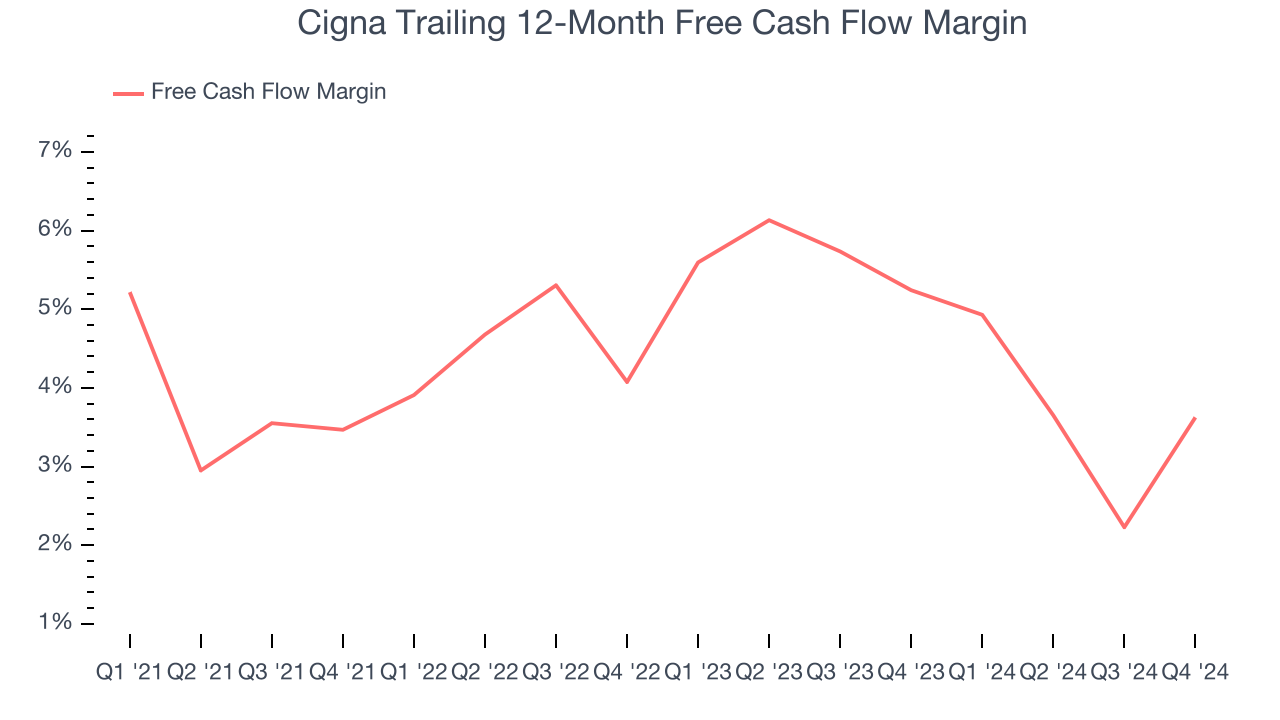
Cigna has shown mediocre cash profitability over the last five years, giving the company limited opportunities to return capital to shareholders. Its free cash flow margin averaged 4.4%, subpar for a healthcare business.
Taking a step back, we can see that Cigna’s margin dropped by 3.9 percentage points during that time. If the trend continues, it could signal it’s in the middle of an investment cycle.
10. Return on Invested Capital (ROIC)
EPS and free cash flow tell us whether a company was profitable while growing its revenue. But was it capital-efficient? Enter ROIC, a metric showing how much operating profit a company generates relative to the money it has raised (debt and equity).
Cigna’s management team makes decent investment decisions and generates value for shareholders. Its five-year average ROIC was 9.2%, slightly better than typical healthcare business.
We like to invest in businesses with high returns, but the trend in a company’s ROIC is what often surprises the market and moves the stock price. On average, Cigna’s ROIC increased by 1.8 percentage points annually over the last few years. This is a great sign when paired with its already strong returns. It could suggest its competitive advantage or profitable growth opportunities are expanding.
11. Balance Sheet Assessment
Cigna reported $8.33 billion of cash and $34.44 billion of debt on its balance sheet in the most recent quarter. As investors in high-quality companies, we primarily focus on two things: 1) that a company’s debt level isn’t too high and 2) that its interest payments are not excessively burdening the business.
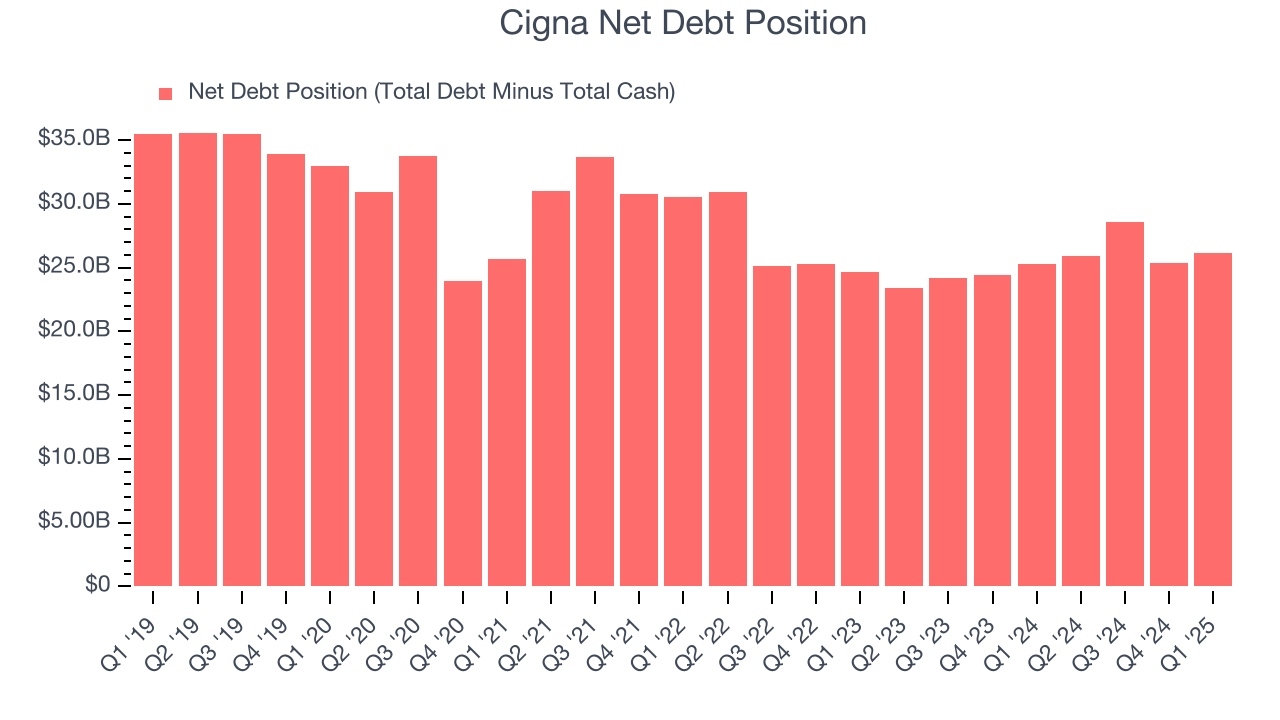
With $11.44 billion of EBITDA over the last 12 months, we view Cigna’s 2.3× net-debt-to-EBITDA ratio as safe. We also see its $1.45 billion of annual interest expenses as appropriate. The company’s profits give it plenty of breathing room, allowing it to continue investing in growth initiatives.
12. Key Takeaways from Cigna’s Q1 Results
We were impressed by how significantly Cigna blew past analysts’ customer base expectations this quarter. We were also excited its revenue outperformed Wall Street’s estimates by a wide margin. Zooming out, we think this was a solid quarter. The stock remained flat at $338 immediately following the results.
13. Is Now The Time To Buy Cigna?
Updated: May 24, 2025 at 11:39 PM EDT
Before deciding whether to buy Cigna or pass, we urge investors to consider business quality, valuation, and the latest quarterly results.
There’s plenty to admire about Cigna. First off, its revenue growth was good over the last five years. And while its operating margins are low compared to other healthcare companies, its scale gives it meaningful leverage when negotiating reimbursement rates. On top of that, its remarkable EPS growth over the last five years shows its profits are trickling down to shareholders.
Cigna’s P/E ratio based on the next 12 months is 10.3x. Looking at the healthcare landscape right now, Cigna trades at a pretty interesting price. If you trust the business and its direction, this is an ideal time to buy.
Wall Street analysts have a consensus one-year price target of $375.21 on the company (compared to the current share price of $317), implying they see 18.4% upside in buying Cigna in the short term.
Want to invest in a High Quality big tech company? We’d point you in the direction of Microsoft and Google, which have durable competitive moats and strong fundamentals, factors that are large determinants of long-term market outperformance.
To get the best start with StockStory, check out our most recent stock picks, and then sign up for our earnings alerts by adding companies to your watchlist. We typically have quarterly earnings results analyzed within seconds of the data being released, giving investors the chance to react before the market has fully absorbed the information. This is especially true for companies reporting pre-market.