
CAVA (CAVA)
CAVA piques our interest. Its fusion of growth, outstanding unit economics, and encouraging prospects make it a unique asset.― StockStory Analyst Team
1. News


2. Summary
Why CAVA Is Interesting
Starting from a single Washington, D.C. location, CAVA (NYSE:CAVA) operates a fast-casual restaurant chain offering customizable Mediterranean-inspired dishes.
- Annual revenue growth of 25.7% over the last three years was superb and indicates its market share is rising
- Market share will likely rise over the next 12 months as its expected revenue growth of 22.2% is robust
- One pitfall is its negative returns on capital show that some of its growth strategies have backfired


CAVA shows some potential. This company is certainly worth watching.
Why Should You Watch CAVA


CAVA is trading at $74.50 per share, or 122.7x forward P/E. The market has high expectations, which are reflected in the premium multiple. This can result in short-term volatility if anything (e.g. a quarterly earnings miss) remotely dampens those hopes.
CAVA can improve its fundamentals over time by putting up good numbers quarter after quarter, year after year. Once that happens, we’ll be happy to recommend the stock.
3. CAVA (CAVA) Research Report: Q1 CY2025 Update
Mediterranean fast-casual restaurant chain CAVA (NYSE:CAVA) reported Q1 CY2025 results exceeding the market’s revenue expectations, with sales up 28.1% year on year to $331.8 million. Its GAAP profit of $0.22 per share was 64.5% above analysts’ consensus estimates.
CAVA (CAVA) Q1 CY2025 Highlights:
- Revenue: $331.8 million vs analyst estimates of $327.7 million (28.1% year-on-year growth, 1.2% beat)
- EPS (GAAP): $0.22 vs analyst estimates of $0.13 (64.5% beat)
- Adjusted EBITDA: $44.85 million vs analyst estimates of $43.85 million (13.5% margin, 2.3% beat)
- EBITDA guidance for the full year is $155.5 million at the midpoint, below analyst estimates of $159.7 million
- Operating Margin: 4.7%, up from 3.6% in the same quarter last year
- Free Cash Flow Margin: 0.8%, similar to the same quarter last year
- Locations: 382 at quarter end, up from 334 in the same quarter last year
- Same-Store Sales rose 10.8% year on year (2.3% in the same quarter last year)
- Market Capitalization: $11.51 billion
Company Overview
Starting from a single Washington, D.C. location, CAVA (NYSE:CAVA) operates a fast-casual restaurant chain offering customizable Mediterranean-inspired dishes.
The company was founded by a group of friends with a desire to bring modern Mediterranean flavors to a broader audience. Starting as a local restaurant, CAVA built its reputation on a build-your-own concept that lets customers choose from a variety of fresh proteins, toppings, and sauces.
CAVA’s restaurants typically feature an open, assembly line-style setup, inviting guests to watch their meals come to life as they move down the line. To reach even more consumers, the brand has expanded beyond its own stores, offering dips and spreads through grocery channels, and further strengthening its presence through the acquisition of Zoës Kitchen. This acquisition helped CAVA break into new markets and scale its operations by converting former Zoës Kitchen sites into new CAVA locations.
In today’s digital age, CAVA provides online ordering and delivery options through its website and mobile app, streamlining the process with real-time tracking and exclusive promotions.
4. Modern Fast Food
Modern fast food is a relatively newer category representing a middle ground between traditional fast food and sit-down restaurants. These establishments feature an expanded menu selection priced above traditional fast food options, often incorporating fresher and cleaner ingredients to serve customers prioritizing quality. These eateries are capitalizing on the perception that your drive-through burger and fries joint is detrimental to your health because of inferior ingredients.
Competitors offering similar menus and service models include Chipotle (NYSE:CMG), Sweetgreen (NYSE:SG), and Noodles & Company (NASDAQ:NDLS).
5. Sales Growth
A company’s long-term performance is an indicator of its overall quality. Any business can experience short-term success, but top-performing ones enjoy sustained growth for years.
With $1.04 billion in revenue over the past 12 months, CAVA is a mid-sized restaurant chain, which sometimes brings disadvantages compared to larger competitors benefiting from better brand awareness and economies of scale. On the bright side, it can still flex high growth rates because it’s working from a smaller revenue base.
As you can see below, CAVA’s sales grew at an incredible 25.7% compounded annual growth rate over the last three years (we compare to 2019 to normalize for COVID-19 impacts) as it opened new restaurants and increased sales at existing, established dining locations.

This quarter, CAVA reported robust year-on-year revenue growth of 28.1%, and its $331.8 million of revenue topped Wall Street estimates by 1.2%.
Looking ahead, sell-side analysts expect revenue to grow 21.2% over the next 12 months, a deceleration versus the last three years. Despite the slowdown, this projection is healthy and implies the market is baking in success for its menu offerings.
6. Restaurant Performance
Number of Restaurants
A restaurant chain’s total number of dining locations influences how much it can sell and how quickly revenue can grow.
CAVA operated 382 locations in the latest quarter. It has opened new restaurants at a rapid clip over the last two years, averaging 15.5% annual growth, much faster than the broader restaurant sector. This gives it a chance to become a large, scaled business over time.
When a chain opens new restaurants, it usually means it’s investing for growth because there’s healthy demand for its meals and there are markets where its concepts have few or no locations.

Same-Store Sales
The change in a company's restaurant base only tells one side of the story. The other is the performance of its existing locations, which informs management teams whether they should expand or downsize their physical footprints. Same-store sales provides a deeper understanding of this issue because it measures organic growth at restaurants open for at least a year.
CAVA has been one of the most successful restaurant chains over the last two years thanks to skyrocketing demand within its existing dining locations. On average, the company has posted exceptional year-on-year same-store sales growth of 13.8%. This performance along with its meaningful buildout of new restaurants suggest it’s playing some aggressive offense.
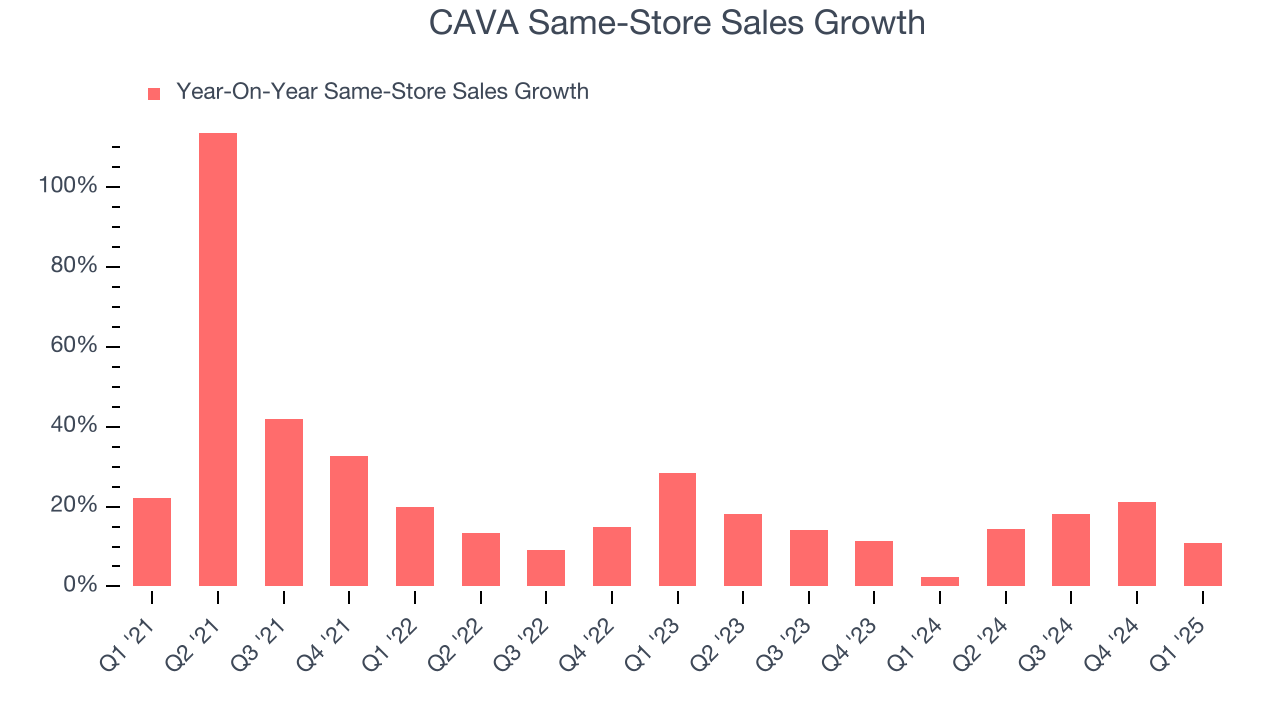
In the latest quarter, CAVA’s same-store sales rose 10.8% year on year. This growth was a deceleration from its historical levels, showing the business is still performing well but losing a bit of steam.
7. Gross Margin & Pricing Power
We prefer higher gross margins because they not only make it easier to generate more operating profits but also indicate pricing power and differentiation, whether it be the dining experience or quality and taste of food.
CAVA has great unit economics for a restaurant company, giving it ample room to invest in areas such as marketing and talent to grow its brand. As you can see below, it averaged an excellent 37.3% gross margin over the last two years. That means CAVA only paid its suppliers $62.67 for every $100 in revenue. 
8. Operating Margin
Operating margin is a key measure of profitability. Think of it as net income - the bottom line - excluding the impact of taxes and interest on debt, which are less connected to business fundamentals.
CAVA was profitable over the last two years but held back by its large cost base. Its average operating margin of 3.6% was weak for a restaurant business. This result is surprising given its high gross margin as a starting point.
On the plus side, CAVA’s operating margin rose by 2.7 percentage points over the last year, as its sales growth gave it operating leverage.

This quarter, CAVA generated an operating profit margin of 4.7%, up 1.2 percentage points year on year. The increase was a welcome development and shows its expenses recently grew slower than its revenue, leading to higher efficiency.
9. Earnings Per Share
We track the change in earnings per share (EPS) for the same reason as long-term revenue growth. Compared to revenue, however, EPS highlights whether a company’s growth is profitable.
CAVA’s full-year EPS flipped from negative to positive over the last three years. This is a good sign and shows it’s at an inflection point.

In Q1, CAVA reported EPS at $0.22, up from $0.12 in the same quarter last year. This print easily cleared analysts’ estimates, and shareholders should be content with the results. Over the next 12 months, Wall Street expects CAVA’s full-year EPS of $1.20 to shrink by 51.5%.
10. Cash Is King
Although earnings are undoubtedly valuable for assessing company performance, we believe cash is king because you can’t use accounting profits to pay the bills.
CAVA has shown poor cash profitability over the last two years, giving the company limited opportunities to return capital to shareholders. Its free cash flow margin averaged 1.5%, lousy for a restaurant business.
Taking a step back, an encouraging sign is that CAVA’s margin expanded by 7.9 percentage points over the last year. The company’s improvement shows it’s heading in the right direction, and we can see it became a less capital-intensive business because its free cash flow profitability rose more than its operating profitability.

CAVA broke even from a free cash flow perspective in Q1. This cash profitability was in line with the comparable period last year and its two-year average.
11. Return on Invested Capital (ROIC)
EPS and free cash flow tell us whether a company was profitable while growing its revenue. But was it capital-efficient? Enter ROIC, a metric showing how much operating profit a company generates relative to the money it has raised (debt and equity).
Although CAVA has shown solid business quality lately, it struggled to grow profitably in the past. Its five-year average ROIC was negative 11.3%, meaning management lost money while trying to expand the business.
12. Balance Sheet Assessment
Companies with more cash than debt have lower bankruptcy risk.

CAVA is a profitable, well-capitalized company with $289.4 million of cash and no debt. This position is 2.5% of its market cap and gives it the freedom to borrow money, return capital to shareholders, or invest in growth initiatives. Leverage is not an issue here.
13. Key Takeaways from CAVA’s Q1 Results
We were impressed by how significantly CAVA blew past analysts’ EPS expectations this quarter. We were also happy its revenue and EPS narrowly outperformed Wall Street’s estimates. On the other hand, its full-year EBITDA guidance missed. Overall, this print had some positives. The market seemed to be hoping for more, and the stock traded down 2.5% to $96.73 immediately following the results.
14. Is Now The Time To Buy CAVA?
Updated: June 17, 2025 at 10:36 PM EDT
The latest quarterly earnings matters, sure, but we actually think longer-term fundamentals and valuation matter more. Investors should consider all these pieces before deciding whether or not to invest in CAVA.
There are some positives when it comes to CAVA’s fundamentals. First off, its revenue growth was exceptional over the last three years. And while its projected EPS for the next year is lacking, its marvelous same-store sales growth is on another level. On top of that, its new restaurant openings have increased its brand equity.
CAVA’s P/E ratio based on the next 12 months is 122.7x. This valuation tells us it’s a bit of a market darling with a lot of good news priced in. This is a good one to add to your watchlist - there are better opportunities elsewhere at the moment.
Wall Street analysts have a consensus one-year price target of $116.59 on the company (compared to the current share price of $74.50).