
General Motors (GM)
General Motors doesn’t excite us. Its weak sales growth shows demand is soft and its low margins are a cause for concern.― StockStory Analyst Team
1. News


2. Summary
Why General Motors Is Not Exciting
Founded in 1908 by William C. Durant, General Motors (NYSE:GM) offers a range of vehicles and automobiles through brands such as Chevrolet, Buick, GMC, and Cadillac.
- Projected sales decline of 5.3% for the next 12 months points to a tough demand environment ahead
- Gross margin of 12.5% reflects its high production costs
- The good news is that its earnings per share grew by 21.6% annually over the last five years, outpacing its peers


General Motors doesn’t measure up to our expectations. We believe there are better opportunities elsewhere.
Why There Are Better Opportunities Than General Motors


At $49 per share, General Motors trades at 4.4x forward P/E. This sure is a cheap multiple, but you get what you pay for.
We’d rather pay up for companies with elite fundamentals than get a bargain on weak ones. Cheap stocks can be value traps, and as their performance deteriorates, they will stay cheap or get even cheaper.
3. General Motors (GM) Research Report: Q1 CY2025 Update
Automotive manufacturer General Motors (NYSE:GM) reported revenue ahead of Wall Street’s expectations in Q1 CY2025, with sales up 2.3% year on year to $44.02 billion. Its non-GAAP profit of $2.78 per share was 4.3% above analysts’ consensus estimates.
General Motors (GM) Q1 CY2025 Highlights:
- Revenue: $44.02 billion vs analyst estimates of $42.85 billion (2.3% year-on-year growth, 2.7% beat)
- Adjusted EPS: $2.78 vs analyst estimates of $2.66 (4.3% beat)
- Adjusted EBITDA: $5.21 billion vs analyst estimates of $6.07 billion (11.8% margin, 14.2% miss)
- Operating Margin: 7.6%, down from 8.7% in the same quarter last year
- Free Cash Flow Margin: 9.6%, up from 0.9% in the same quarter last year
- Sales Volumes rose 1.8% year on year (3.7% in the same quarter last year)
- Market Capitalization: $45.83 billion
Company Overview
Founded in 1908 by William C. Durant, General Motors (NYSE:GM) offers a range of vehicles and automobiles through brands such as Chevrolet, Buick, GMC, and Cadillac.
General Motors Company (GM) is a global automotive company that designs, builds, and sells trucks, crossovers, cars, and automobile parts worldwide. The company's operations are organized into four automotive segments: GM North America, GM International, GM Cruise, and GM Financial. GM's core brands include Buick, Cadillac, Chevrolet, and GMC, and it also has equity ownership stakes in entities that meet customer demands in other countries, primarily in China.
GM's vision for the future is a world with zero crashes, zero emissions, and zero congestion, which guides its growth-focused strategy to invest in electric vehicles (EVs), autonomous vehicles (AVs), software-enabled services and subscriptions, and new business opportunities. The company's Ultium platform is a key element in its EV strategy, providing flexibility to expand its EV portfolio across multiple segments and price points.
General Motors primarily generates revenue through wholesale vehicle sales to independent dealerships, transferring inventory risk to them. Additional revenue streams include leasing and financing through GM Financial, parts and service sales, and software-enabled services like OnStar. GM is also developing new revenue sources from electric vehicles, autonomous technology (Cruise), and potential technology licensing to other automakers.
4. Automobile Manufacturing
Much capital investment and technical know-how are needed to manufacture functional, safe, and aesthetically pleasing automobiles for the mass market. Barriers to entry are therefore high, and auto manufacturers with economies of scale can boast strong economic moats. However, this doesn’t insulate them from new entrants, as electric vehicles (EVs) have entered the market and are upending it. This has forced established manufacturers to not only contend with emerging EV-first competitors but also decide how much they want to invest in these disruptive technologies, which will likely cannibalize their legacy offerings.
GM's competitors in the automotive industry include Ford (NYSE:F), Toyota (NYSE:TM), Volkswagen (OTC:VWAGY), and Honda (NYSE:HMC).
5. Sales Growth
A company’s long-term sales performance is one signal of its overall quality. Any business can put up a good quarter or two, but the best consistently grow over the long haul. Regrettably, General Motors’s sales grew at a mediocre 6.9% compounded annual growth rate over the last five years. This was below our standard for the industrials sector and is a tough starting point for our analysis.

Long-term growth is the most important, but within industrials, a half-decade historical view may miss new industry trends or demand cycles. General Motors’s annualized revenue growth of 8.3% over the last two years is above its five-year trend, suggesting some bright spots. 
We can better understand the company’s revenue dynamics by analyzing its number of units sold, which reached 912,000 in the latest quarter. Over the last two years, General Motors’s units sold averaged 5.8% year-on-year growth. Because this number is lower than its revenue growth, we can see the company benefited from price increases. 
This quarter, General Motors reported modest year-on-year revenue growth of 2.3% but beat Wall Street’s estimates by 2.7%.
Looking ahead, sell-side analysts expect revenue to decline by 5.3% over the next 12 months, a deceleration versus the last two years. This projection doesn't excite us and suggests its products and services will face some demand challenges.
6. Gross Margin & Pricing Power
General Motors has bad unit economics for an industrials business, signaling it operates in a competitive market. This is also because it’s an automobile manufacturer.
Automobile manufacturers have structurally lower profitability as they often break even on the initial sale of vehicles and instead make money on parts and servicing, which come many years later - this explains why new entrants such as Rivian, Lucid, and Nikola have negative gross margins. As you can see below, these dynamics culminated in an average 12.5% gross margin for General Motors over the last five years.

In Q1, General Motors produced a 12.2% gross profit margin, down 1.7 percentage points year on year. On a wider time horizon, the company’s full-year margin has remained steady over the past four quarters, suggesting its input costs (such as raw materials and manufacturing expenses) have been stable and it isn’t under pressure to lower prices.
7. Operating Margin
General Motors was profitable over the last five years but held back by its large cost base. Its average operating margin of 6.6% was weak for an industrials business. This result isn’t too surprising given its low gross margin as a starting point.
Analyzing the trend in its profitability, General Motors’s operating margin might fluctuated slightly but has generally stayed the same over the last five years. This raises questions about the company’s expense base because its revenue growth should have given it leverage on its fixed costs, resulting in better economies of scale and profitability.

This quarter, General Motors generated an operating margin profit margin of 7.6%, down 1.1 percentage points year on year. Since General Motors’s gross margin decreased more than its operating margin, we can assume its recent inefficiencies were driven more by weaker leverage on its cost of sales rather than increased marketing, R&D, and administrative overhead expenses.
8. Earnings Per Share
We track the long-term change in earnings per share (EPS) for the same reason as long-term revenue growth. Compared to revenue, however, EPS highlights whether a company’s growth is profitable.
General Motors’s EPS grew at an astounding 21.6% compounded annual growth rate over the last five years, higher than its 6.9% annualized revenue growth. However, this alone doesn’t tell us much about its business quality because its operating margin didn’t expand.

We can take a deeper look into General Motors’s earnings to better understand the drivers of its performance. A five-year view shows that General Motors has repurchased its stock, shrinking its share count by 30.4%. This tells us its EPS outperformed its revenue not because of increased operational efficiency but financial engineering, as buybacks boost per share earnings. 
Like with revenue, we analyze EPS over a shorter period to see if we are missing a change in the business.
For General Motors, its two-year annual EPS growth of 17.8% was lower than its five-year trend. We still think its growth was good and hope it can accelerate in the future.
In Q1, General Motors reported EPS at $2.78, up from $2.62 in the same quarter last year. This print beat analysts’ estimates by 4.3%. Over the next 12 months, Wall Street expects General Motors’s full-year EPS of $10.72 to grow 1.9%.
9. Cash Is King
Free cash flow isn't a prominently featured metric in company financials and earnings releases, but we think it's telling because it accounts for all operating and capital expenses, making it tough to manipulate. Cash is king.
General Motors has shown decent cash profitability, giving it some flexibility to reinvest or return capital to investors. The company’s free cash flow margin averaged 6.5% over the last five years, slightly better than the broader industrials sector.
Taking a step back, we can see that General Motors’s margin dropped by 3.3 percentage points during that time. If its declines continue, it could signal increasing investment needs and capital intensity.

General Motors’s free cash flow clocked in at $4.25 billion in Q1, equivalent to a 9.6% margin. This result was good as its margin was 8.8 percentage points higher than in the same quarter last year, but we wouldn’t put too much weight on the short term because investment needs can be seasonal, causing temporary swings. Long-term trends are more important.
10. Return on Invested Capital (ROIC)
EPS and free cash flow tell us whether a company was profitable while growing its revenue. But was it capital-efficient? A company’s ROIC explains this by showing how much operating profit it makes compared to the money it has raised (debt and equity).
Although General Motors hasn’t been the highest-quality company lately, it historically found a few growth initiatives that worked out well. Its five-year average ROIC was 15.6%, impressive for an industrials business.
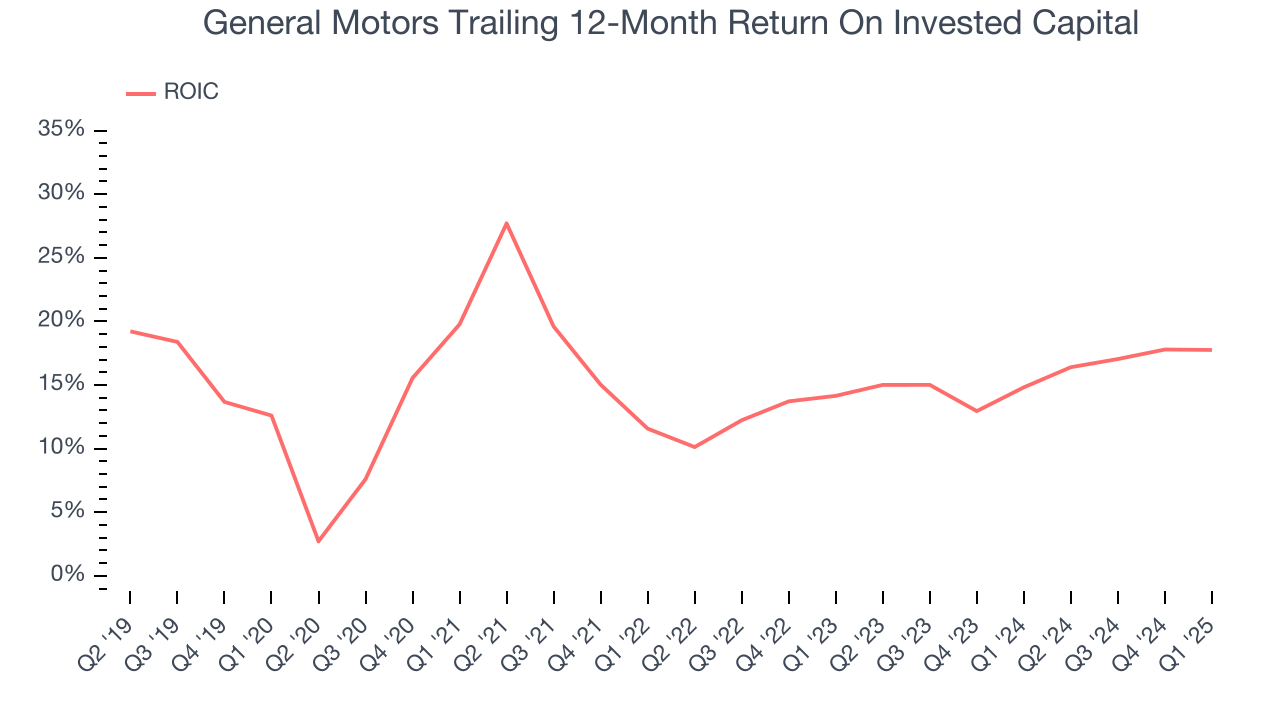
We like to invest in businesses with high returns, but the trend in a company’s ROIC is what often surprises the market and moves the stock price. Uneventfully, General Motors’s ROIC has stayed the same over the last few years. Given the company’s underwhelming financial performance in other areas, we’d like to see its returns improve before recommending the stock.
11. Balance Sheet Assessment
General Motors reported $27.49 billion of cash and $132.7 billion of debt on its balance sheet in the most recent quarter. As investors in high-quality companies, we primarily focus on two things: 1) that a company’s debt level isn’t too high and 2) that its interest payments are not excessively burdening the business.

With $22.24 billion of EBITDA over the last 12 months, we view General Motors’s 4.7× net-debt-to-EBITDA ratio as safe. We also see its $193 million of annual interest expenses as appropriate. The company’s profits give it plenty of breathing room, allowing it to continue investing in growth initiatives.
12. Key Takeaways from General Motors’s Q1 Results
We enjoyed seeing General Motors beat analysts’ revenue expectations this quarter. We were also happy its adjusted operating income narrowly outperformed Wall Street’s estimates. On the other hand, its EBITDA missed. Zooming out, we think this was a mixed quarter. The stock remained flat at $47.68 immediately following the results.
13. Is Now The Time To Buy General Motors?
Updated: June 23, 2025 at 11:31 PM EDT
The latest quarterly earnings matters, sure, but we actually think longer-term fundamentals and valuation matter more. Investors should consider all these pieces before deciding whether or not to invest in General Motors.
General Motors isn’t a terrible business, but it isn’t one of our picks. To begin with, its revenue growth was mediocre over the last five years, and analysts expect its demand to deteriorate over the next 12 months. And while its astounding EPS growth over the last five years shows its profits are trickling down to shareholders, the downside is its low gross margins indicate some combination of competitive pressures and high production costs. On top of that, its projected EPS for the next year is lacking.
General Motors’s P/E ratio based on the next 12 months is 4.4x. While this valuation is reasonable, we don’t really see a big opportunity at the moment. We're fairly confident there are better investments elsewhere.
Wall Street analysts have a consensus one-year price target of $54.15 on the company (compared to the current share price of $49).