
Timken (TKR)
Timken is up against the odds. Its weak sales growth and declining returns on capital show its demand and profits are shrinking.― StockStory Analyst Team
1. News
2. Summary
Why We Think Timken Will Underperform
Established after the founder noticed the difficulty freight wagons had making sharp turns, Timken (NYSE:TKR) is a provider of industrial parts used across various sectors.
- Sales tumbled by 1.2% annually over the last two years, showing market trends are working against its favor during this cycle
- Sales were less profitable over the last two years as its earnings per share fell by 8.7% annually, worse than its revenue declines
- Sales are projected to be flat over the next 12 months and imply weak demand


Timken doesn’t check our boxes. There are superior stocks for sale in the market.
Why There Are Better Opportunities Than Timken


Timken’s stock price of $70.56 implies a valuation ratio of 12.4x forward P/E. This multiple is cheaper than most industrials peers, but we think this is justified.
Cheap stocks can look like a great deal at first glance, but they can be value traps. They often have less earnings power, meaning there is more reliance on a re-rating to generate good returns - an unlikely scenario for low-quality companies.
3. Timken (TKR) Research Report: Q1 CY2025 Update
Industrial component provider Timken (NYSE:TKR) reported revenue ahead of Wall Street’s expectations in Q1 CY2025, but sales fell by 4.2% year on year to $1.14 billion. Its non-GAAP profit of $1.40 per share was 1.5% below analysts’ consensus estimates.
Timken (TKR) Q1 CY2025 Highlights:
- Revenue: $1.14 billion vs analyst estimates of $1.13 billion (4.2% year-on-year decline, 1.1% beat)
- Adjusted EPS: $1.40 vs analyst expectations of $1.42 (1.5% miss)
- Adjusted EBITDA: $208.1 million vs analyst estimates of $211.7 million (18.2% margin, 1.7% miss)
- Management lowered its full-year Adjusted EPS guidance to $5.35 at the midpoint, a 3.6% decrease
- Operating Margin: 12.6%, down from 15.5% in the same quarter last year
- Free Cash Flow Margin: 2.1%, up from 0.4% in the same quarter last year
- Organic Revenue fell 3.1% year on year (-9.2% in the same quarter last year)
- Market Capitalization: $4.58 billion
Company Overview
Established after the founder noticed the difficulty freight wagons had making sharp turns, Timken (NYSE:TKR) is a provider of industrial parts used across various sectors.
Timken was established in 1899 after the founder developed a bearing to address this issue. The company then made acquisitions to increase its product offerings and manufacturing capabilities. While the company has primarily targeted the acquisition of small- to mid-sized companies, its $840 million purchase of The Torrington Company in 2003 notably doubled the size of the enterprise.
Today, Timken produces a variety of goods across the industrial sector. Its products range from bearings used to reduce friction between moving parts and power transmission products (helps machines transfer power from one part to another) to components such as gears, shafts, and seals. These parts are a piece of a larger system used to operate manufacturing machinery or power systems like wind turbines. The company also offers maintenance and repair services to complement its products.
Timken generates revenue through its direct sales, long-term supply contracts, and aftermarket sales. Its direct sales involve a one-time sale of its product while long-term supply contracts are tailored to customers needing a larger, consistent supply of products. Its long-term supply contracts typically range from 3 to 5 years, though it can be longer. Additionally, its aftermarket sales provide replacement parts to keep existing machinery and equipment running.
4. Engineered Components and Systems
Engineered components and systems companies possess technical know-how in sometimes narrow areas such as metal forming or intelligent robotics. Lately, automation and connected equipment collecting analyzable data have been trending, creating new demand. On the other hand, like the broader industrials sector, engineered components and systems companies are at the whim of economic cycles. Consumer spending and interest rates, for example, can greatly impact the industrial production that drives demand for these companies’ offerings.
Competitors offering similar products include Amphenol (NYSE:APH), Barnes (NYSE:B), and Illinois Tool Works (NYSE:ITW).
5. Sales Growth
A company’s long-term sales performance can indicate its overall quality. Any business can have short-term success, but a top-tier one grows for years. Over the last five years, Timken grew its sales at a sluggish 3.9% compounded annual growth rate. This was below our standard for the industrials sector and is a rough starting point for our analysis.

We at StockStory place the most emphasis on long-term growth, but within industrials, a half-decade historical view may miss cycles, industry trends, or a company capitalizing on catalysts such as a new contract win or a successful product line. Timken’s performance shows it grew in the past but relinquished its gains over the last two years, as its revenue fell by 1.2% annually. 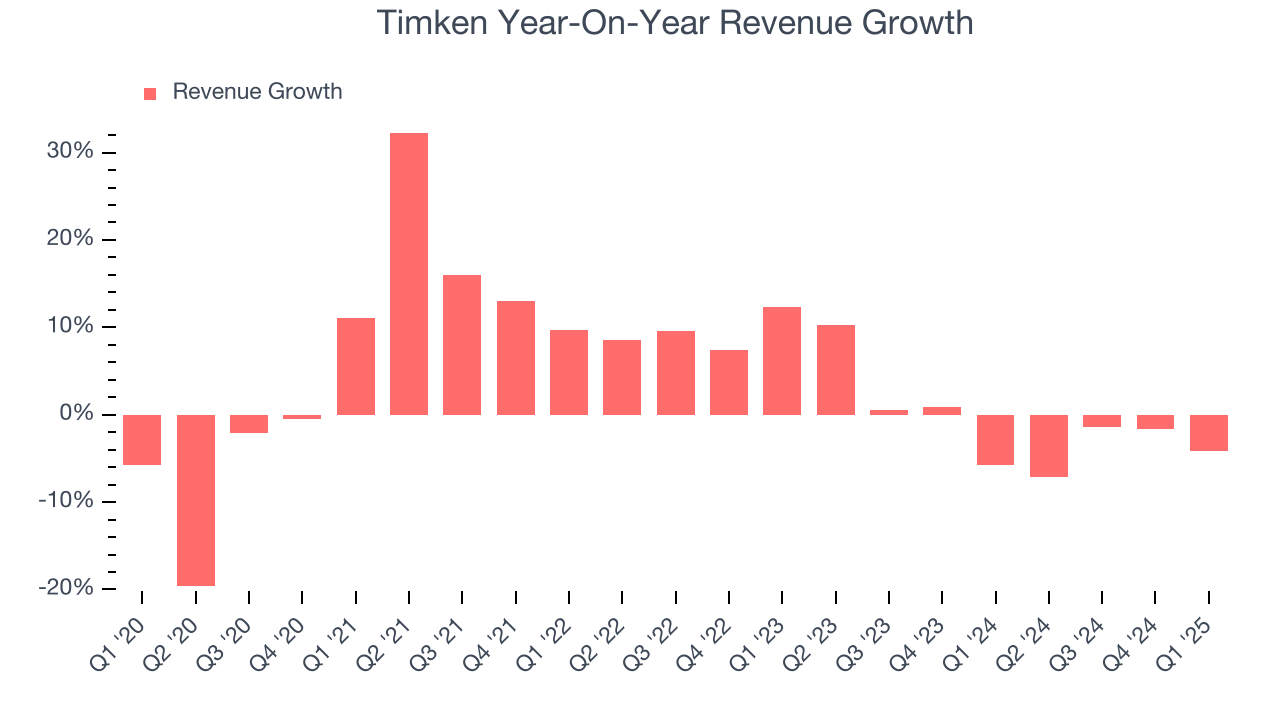
We can dig further into the company’s sales dynamics by analyzing its organic revenue, which strips out one-time events like acquisitions and currency fluctuations that don’t accurately reflect its fundamentals. Over the last two years, Timken’s organic revenue averaged 4% year-on-year declines. Because this number is lower than its normal revenue growth, we can see that some mixture of acquisitions and foreign exchange rates boosted its headline results. 
This quarter, Timken’s revenue fell by 4.2% year on year to $1.14 billion but beat Wall Street’s estimates by 1.1%.
Looking ahead, sell-side analysts expect revenue to decline by 1.1% over the next 12 months, similar to its two-year rate. This projection is underwhelming and implies its newer products and services will not lead to better top-line performance yet.
6. Gross Margin & Pricing Power
Timken’s gross margin is slightly below the average industrials company, giving it less room to invest in areas such as research and development. As you can see below, it averaged a 29.8% gross margin over the last five years. Said differently, Timken had to pay a chunky $70.20 to its suppliers for every $100 in revenue. 
Timken produced a 31.5% gross profit margin in Q1, down 2.2 percentage points year on year. On a wider time horizon, the company’s full-year margin has remained steady over the past four quarters, suggesting its input costs (such as raw materials and manufacturing expenses) have been stable and it isn’t under pressure to lower prices.
7. Operating Margin
Timken has been an efficient company over the last five years. It was one of the more profitable businesses in the industrials sector, boasting an average operating margin of 13.2%. This result was particularly impressive because of its low gross margin, which is mostly a factor of what it sells and takes huge shifts to move meaningfully. Companies have more control over their operating margins, and it’s a show of well-managed operations if they’re high when gross margins are low.
Looking at the trend in its profitability, Timken’s operating margin might fluctuated slightly but has generally stayed the same over the last five years. This raises questions about the company’s expense base because its revenue growth should have given it leverage on its fixed costs, resulting in better economies of scale and profitability.

In Q1, Timken generated an operating profit margin of 12.6%, down 2.9 percentage points year on year. Since Timken’s operating margin decreased more than its gross margin, we can assume it was less efficient because expenses such as marketing, R&D, and administrative overhead increased.
8. Earnings Per Share
Revenue trends explain a company’s historical growth, but the long-term change in earnings per share (EPS) points to the profitability of that growth – for example, a company could inflate its sales through excessive spending on advertising and promotions.
Timken’s unimpressive 4.4% annual EPS growth over the last five years aligns with its revenue performance. This tells us it maintained its per-share profitability as it expanded.

Like with revenue, we analyze EPS over a shorter period to see if we are missing a change in the business.
Timken’s two-year annual EPS declines of 9.5% were bad and lower than its two-year revenue performance.
In Q1, Timken reported EPS at $1.40, down from $1.77 in the same quarter last year. This print slightly missed analysts’ estimates. Over the next 12 months, Wall Street expects Timken’s full-year EPS of $5.41 to grow 4.9%.
9. Cash Is King
Free cash flow isn't a prominently featured metric in company financials and earnings releases, but we think it's telling because it accounts for all operating and capital expenses, making it tough to manipulate. Cash is king.
Timken has shown decent cash profitability, giving it some flexibility to reinvest or return capital to investors. The company’s free cash flow margin averaged 7.6% over the last five years, slightly better than the broader industrials sector.
Taking a step back, we can see that Timken’s margin dropped by 4.8 percentage points during that time. If its declines continue, it could signal increasing investment needs and capital intensity.

Timken’s free cash flow clocked in at $23.4 million in Q1, equivalent to a 2.1% margin. This result was good as its margin was 1.6 percentage points higher than in the same quarter last year, but we wouldn’t read too much into the short term because investment needs can be seasonal, leading to temporary swings. Long-term trends trump fluctuations.
10. Return on Invested Capital (ROIC)
EPS and free cash flow tell us whether a company was profitable while growing its revenue. But was it capital-efficient? Enter ROIC, a metric showing how much operating profit a company generates relative to the money it has raised (debt and equity).
Timken’s management team makes decent investment decisions and generates value for shareholders. Its five-year average ROIC was 11%, slightly better than typical industrials business.

We like to invest in businesses with high returns, but the trend in a company’s ROIC is what often surprises the market and moves the stock price. Uneventfully, Timken’s ROIC has stayed the same over the last few years. Given the company’s underwhelming financial performance in other areas, we’d like to see its returns improve before recommending the stock.
11. Balance Sheet Assessment
Timken reported $376.1 million of cash and $2.22 billion of debt on its balance sheet in the most recent quarter. As investors in high-quality companies, we primarily focus on two things: 1) that a company’s debt level isn’t too high and 2) that its interest payments are not excessively burdening the business.

With $806.5 million of EBITDA over the last 12 months, we view Timken’s 2.3× net-debt-to-EBITDA ratio as safe. We also see its $105 million of annual interest expenses as appropriate. The company’s profits give it plenty of breathing room, allowing it to continue investing in growth initiatives.
12. Key Takeaways from Timken’s Q1 Results
It was good to see Timken narrowly top analysts’ revenue expectations this quarter. We were also happy its organic revenue narrowly outperformed Wall Street’s estimates. On the other hand, its full-year EPS guidance missed and its EBITDA fell short of Wall Street’s estimates. Overall, this quarter could have been better. The stock traded down 3.2% to $63.17 immediately following the results.
13. Is Now The Time To Buy Timken?
Updated: June 23, 2025 at 11:24 PM EDT
We think that the latest earnings result is only one piece of the bigger puzzle. If you’re deciding whether to own Timken, you should also grasp the company’s longer-term business quality and valuation.
We cheer for all companies making their customers lives easier, but in the case of Timken, we’ll be cheering from the sidelines. For starters, its revenue growth was uninspiring over the last five years, and analysts expect its demand to deteriorate over the next 12 months. And while its strong operating margins show it’s a well-run business, the downside is its organic revenue declined. On top of that, its cash profitability fell over the last five years.
Timken’s P/E ratio based on the next 12 months is 12.5x. This valuation multiple is fair, but we don’t have much confidence in the company. There are more exciting stocks to buy at the moment.
Wall Street analysts have a consensus one-year price target of $76.65 on the company (compared to the current share price of $71.18).