
Under Armour (UAA)
Under Armour is in for a bumpy ride. Its low returns on capital and plummeting sales suggest it struggles to generate demand and profits, a red flag.― StockStory Analyst Team
1. News


2. Summary
Why We Think Under Armour Will Underperform
Founded in 1996 by a former University of Maryland football player, Under Armour (NYSE:UAA) is an apparel brand specializing in sportswear designed to improve athletic performance.
- Annual sales declines of 6.5% for the past two years show its products and services struggled to connect with the market
- Projected sales decline of 2.2% over the next 12 months indicates demand will continue deteriorating
- Ability to fund investments or reward shareholders with increased buybacks or dividends is restricted by its weak free cash flow margin of -0.2% for the last two years


Under Armour’s quality doesn’t meet our bar. There are more promising alternatives.
Why There Are Better Opportunities Than Under Armour


At $6.33 per share, Under Armour trades at 18.1x forward P/E. This multiple rich for the business quality. Not a great combination.
Paying a premium for high-quality companies with strong long-term earnings potential is preferable to owning challenged businesses with questionable prospects. That helps the prudent investor sleep well at night.
3. Under Armour (UAA) Research Report: Q1 CY2025 Update
Athletic apparel company Under Armour (NYSE:UAA) reported Q1 CY2025 results exceeding the market’s revenue expectations, but sales fell by 11.4% year on year to $1.18 billion. On the other hand, next quarter’s revenue guidance of $1.13 billion was less impressive, coming in 3.4% below analysts’ estimates. Its non-GAAP loss of $0.08 per share was in line with analysts’ consensus estimates.
Under Armour (UAA) Q1 CY2025 Highlights:
- Revenue: $1.18 billion vs analyst estimates of $1.17 billion (11.4% year-on-year decline, 1.3% beat)
- Adjusted EPS: -$0.08 vs analyst estimates of -$0.08 (in line)
- Adjusted EBITDA: $19.92 million vs analyst estimates of -$4.15 million (1.7% margin, significant beat)
- Revenue Guidance for Q2 CY2025 is $1.13 billion at the midpoint, below analyst estimates of $1.17 billion
- Adjusted EPS guidance for Q2 CY2025 is $0.02 at the midpoint, above analyst estimates of $0
- Operating Margin: -6.1%, down from -0.3% in the same quarter last year
- Free Cash Flow was -$231 million compared to -$156.7 million in the same quarter last year
- Constant Currency Revenue fell 10% year on year (-4.9% in the same quarter last year)
- Market Capitalization: $2.60 billion
Company Overview
Founded in 1996 by a former University of Maryland football player, Under Armour (NYSE:UAA) is an apparel brand specializing in sportswear designed to improve athletic performance.
Under Armour gained popularity through its moisture-wicking synthetic fabric, a revolutionary technology at the time, designed to keep athletes cool and dry during exercise. This set the company apart in its early days and remains a cornerstone of its product lines. The brand has since expanded its offerings to include compression wear, performance footwear, and sports accessories.
The company invests in research and development to enhance its products. This has led to the introduction of fabrics including "HeatGear" and "ColdGear", which regulate body temperature. The company has also created online fitness platforms and smart gear that integrate digital technology into workout apparel.
Under Armour’s marketing strategy has been an important part of the business. The brand has forged partnerships with high-profile athletes and teams across various sports, leveraging these relationships to enhance its visibility and appeal. Additionally, Under Armour's marketing campaigns often focus on the determination and grit of athletes, resonating with consumers who are passionate about fitness and sports.
4. Apparel and Accessories
Thanks to social media and the internet, not only are styles changing more frequently today than in decades past but also consumers are shifting the way they buy their goods, favoring omnichannel and e-commerce experiences. Some apparel and accessories companies have made concerted efforts to adapt while those who are slower to move may fall behind.
Under Armour's primary competitors include Nike (NYSE:NKE), Lululemon (NASDAQ:LULU), Columbia Sportswear (NASDAQ:COLM), Adidas (ETR:ADS), and Puma (ETR:PUM).
5. Sales Growth
Reviewing a company’s long-term sales performance reveals insights into its quality. Any business can have short-term success, but a top-tier one grows for years. Unfortunately, Under Armour struggled to consistently increase demand as its $5.16 billion of sales for the trailing 12 months was close to its revenue five years ago. This wasn’t a great result and is a sign of poor business quality.

Long-term growth is the most important, but within consumer discretionary, product cycles are short and revenue can be hit-driven due to rapidly changing trends and consumer preferences. Under Armour’s recent performance shows its demand remained suppressed as its revenue has declined by 6.5% annually over the last two years. 
We can better understand the company’s sales dynamics by analyzing its constant currency revenue, which excludes currency movements that are outside their control and not indicative of demand. Over the last two years, its constant currency sales averaged 6.3% year-on-year declines. Because this number aligns with its normal revenue growth, we can see that Under Armour has properly hedged its foreign currency exposure. 
This quarter, Under Armour’s revenue fell by 11.4% year on year to $1.18 billion but beat Wall Street’s estimates by 1.3%. Company management is currently guiding for a 4.5% year-on-year decline in sales next quarter.
Looking further ahead, sell-side analysts expect revenue to remain flat over the next 12 months. Although this projection indicates its newer products and services will fuel better top-line performance, it is still below average for the sector.
6. Operating Margin
Under Armour’s operating margin has been trending down over the last 12 months, and it ended up breaking even over the last two years. The company’s performance was inadequate, showing its operating expenses were rising and it couldn’t pass those costs onto its customers.

In Q1, Under Armour generated an operating profit margin of negative 6.1%, down 5.8 percentage points year on year. This contraction shows it was less efficient because its expenses increased relative to its revenue.
7. Earnings Per Share
We track the long-term change in earnings per share (EPS) for the same reason as long-term revenue growth. Compared to revenue, however, EPS highlights whether a company’s growth is profitable.
Under Armour’s full-year EPS flipped from negative to positive over the last five years. This is encouraging and shows it’s at a critical moment in its life.
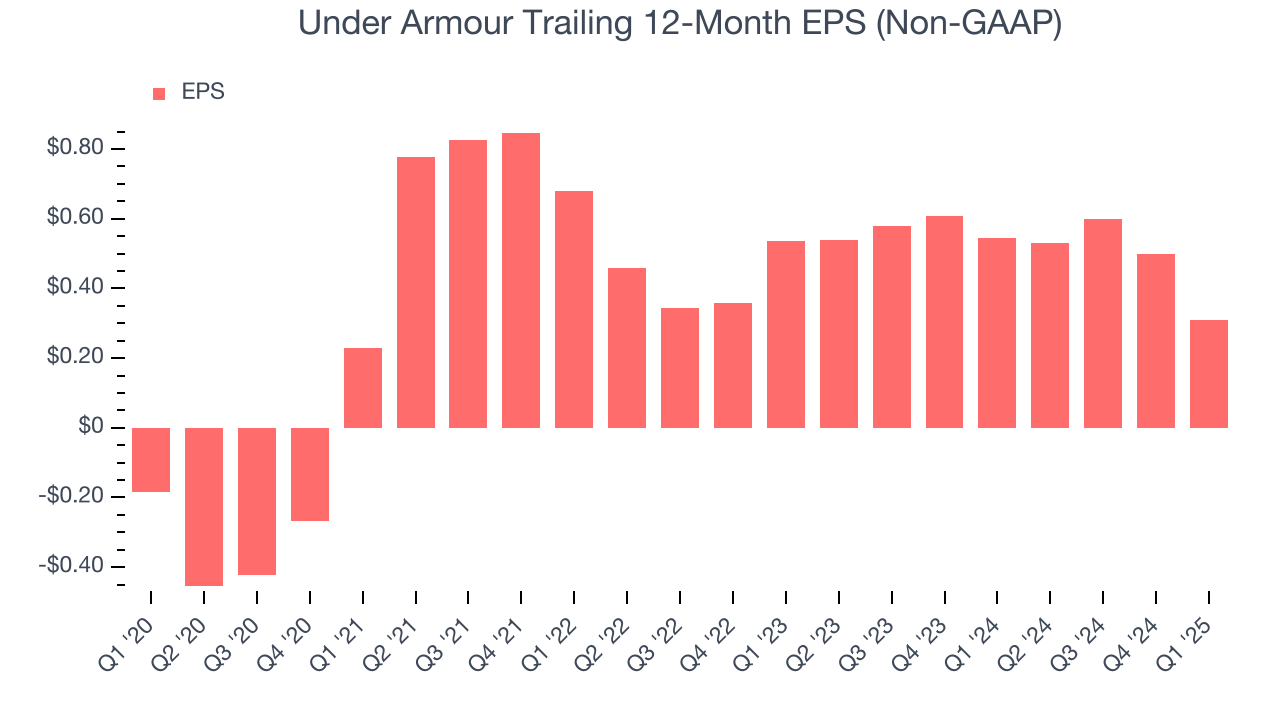
In Q1, Under Armour reported EPS at negative $0.08, down from $0.11 in the same quarter last year. This print was close to analysts’ estimates. Over the next 12 months, Wall Street expects Under Armour to perform poorly. Analysts forecast its full-year EPS of $0.31 will hit $0.35.
8. Cash Is King
Free cash flow isn't a prominently featured metric in company financials and earnings releases, but we think it's telling because it accounts for all operating and capital expenses, making it tough to manipulate. Cash is king.
Under Armour broke even from a free cash flow perspective over the last two years, giving the company limited opportunities to return capital to shareholders.

Under Armour burned through $231 million of cash in Q1, equivalent to a negative 19.6% margin. The company’s cash burn increased from $156.7 million of lost cash in the same quarter last year.
Looking forward, analysts predict Under Armour will generate cash on a full-year basis. Their consensus estimates imply its free cash flow margin of negative 4.4% for the last 12 months will increase to positive 2.5%, giving it more optionality.
9. Return on Invested Capital (ROIC)
EPS and free cash flow tell us whether a company was profitable while growing its revenue. But was it capital-efficient? A company’s ROIC explains this by showing how much operating profit it makes compared to the money it has raised (debt and equity).
Under Armour historically did a mediocre job investing in profitable growth initiatives. Its five-year average ROIC was 6.5%, somewhat low compared to the best consumer discretionary companies that consistently pump out 25%+.

We like to invest in businesses with high returns, but the trend in a company’s ROIC is what often surprises the market and moves the stock price. Over the last few years, Under Armour’s ROIC has unfortunately decreased. Paired with its already low returns, these declines suggest its profitable growth opportunities are few and far between.
10. Balance Sheet Assessment
Under Armour reported $501.4 million of cash and $1.30 billion of debt on its balance sheet in the most recent quarter. As investors in high-quality companies, we primarily focus on two things: 1) that a company’s debt level isn’t too high and 2) that its interest payments are not excessively burdening the business.

With $350.4 million of EBITDA over the last 12 months, we view Under Armour’s 2.3× net-debt-to-EBITDA ratio as safe. We also see its $6.12 million of annual interest expenses as appropriate. The company’s profits give it plenty of breathing room, allowing it to continue investing in growth initiatives.
11. Key Takeaways from Under Armour’s Q1 Results
We were impressed by Under Armour’s optimistic EPS guidance for next quarter, which blew past analysts’ expectations. We were also excited its EBITDA outperformed Wall Street’s estimates by a wide margin. On the other hand, its revenue guidance for next quarter missed. Overall, this print had some key positives. The stock traded up 2.3% to $6.36 immediately following the results.
12. Is Now The Time To Buy Under Armour?
Updated: June 17, 2025 at 10:44 PM EDT
Before making an investment decision, investors should account for Under Armour’s business fundamentals and valuation in addition to what happened in the latest quarter.
We see the value of companies helping consumers, but in the case of Under Armour, we’re out. First off, its revenue growth was weak over the last five years, and analysts expect its demand to deteriorate over the next 12 months. And while its astounding EPS growth over the last five years shows its profits are trickling down to shareholders, the downside is its constant currency sales performance has disappointed. On top of that, its projected EPS for the next year is lacking.
Under Armour’s P/E ratio based on the next 12 months is 18.1x. At this valuation, there’s a lot of good news priced in - we think there are better opportunities elsewhere.
Wall Street analysts have a consensus one-year price target of $7.45 on the company (compared to the current share price of $6.33).
Although the price target is bullish, readers should exercise caution because analysts tend to be overly optimistic. The firms they work for, often big banks, have relationships with companies that extend into fundraising, M&A advisory, and other rewarding business lines. As a result, they typically hesitate to say bad things for fear they will lose out. We at StockStory do not suffer from such conflicts of interest, so we’ll always tell it like it is.