
Amtech (ASYS)
Amtech faces an uphill battle. Not only has its sales growth been weak but also its negative returns on capital show it destroyed value.― StockStory Analyst Team
1. News


2. Summary
Why We Think Amtech Will Underperform
Focusing on the silicon carbide and power semiconductor sectors, Amtech Systems (NASDAQ:ASYS) produces the machinery and related chemicals needed for manufacturing semiconductors.
- Persistent operating margin losses suggest the business manages its expenses poorly
- Push for growth has led to negative returns on capital, signaling value destruction, and its shrinking returns suggest its past profit sources are losing steam
- Earnings per share have dipped by 16% annually over the past five years, which is concerning because stock prices follow EPS over the long term


Amtech is in the doghouse. Better stocks can be found in the market.
Why There Are Better Opportunities Than Amtech


Amtech’s stock price of $4.02 implies a valuation ratio of 15.2x forward EV-to-EBITDA. This multiple expensive for its subpar fundamentals.
It’s better to invest in high-quality businesses with strong long-term earnings potential rather than to buy lower-quality companies with open questions and big downside risks.
3. Amtech (ASYS) Research Report: Q1 CY2025 Update
Semiconductor production equipment provider Amtech Systems (NASDAQ:ASYS) missed Wall Street’s revenue expectations in Q1 CY2025, with sales falling 38.7% year on year to $15.6 million. Next quarter’s revenue guidance of $17.5 million underwhelmed, coming in 28.9% below analysts’ estimates. Its non-GAAP loss of $0.16 per share was significantly below analysts’ consensus estimates.
Amtech (ASYS) Q1 CY2025 Highlights:
- Revenue: $15.6 million vs analyst estimates of $18.5 million (38.7% year-on-year decline, 15.7% miss)
- Adjusted EPS: -$0.16 vs analyst estimates of $0.01 (significant miss)
- Adjusted EBITDA: -$1.36 million vs analyst estimates of $300,000 (-8.7% margin, significant miss)
- Revenue Guidance for Q2 CY2025 is $17.5 million at the midpoint, below analyst estimates of $24.6 million
- Operating Margin: -202%, down from -2.8% in the same quarter last year
- Free Cash Flow was $2.93 million, up from -$884,000 in the same quarter last year
- Inventory Days Outstanding: 119, down from 155 in the previous quarter
- Market Capitalization: $49.01 million
Company Overview
Focusing on the silicon carbide and power semiconductor sectors, Amtech Systems (NASDAQ:ASYS) produces the machinery and related chemicals needed for manufacturing semiconductors.
Amtech Systems was founded in 1981 by Jong S. Whang, who previously had experience in both semiconductor processing and manufacturing. The company went public in 2017.
Semiconductor manufacturing begins with a silicon wafer upon which chips are constructed through the application and manipulation of thin layers of film that act as conductors, semiconductors, or insulators. It is a complex process requiring precision tools, specific temperatures at various stages, and ideal environments. Deviations in materials, measurements, or temperatures could result in defects that cost money, time, and other resources.
Amtech's product portfolio primarily focuses on thermal systems and wafer polishing equipment. The company’s horizontal furnaces address the vital fabrication stages of diffusion, oxidation, and annealing. Diffusion is an early stage that uses heat to remove impurities from wafers, oxidation employs high temperatures to turn silicon on the wafer into silicon dioxide to produce insulation properties, and annealing involves heating wafers to change their electrical properties. Amtech's polishing products abrade wafers in a high-precision manner to ensure the flatness, parallelism, and surface finish needed for chip construction.
Companies offering competing semiconductor production equipment include Centrotherm, CVD Equipment (NASDAQ:CVV), Vitronics Soltec, and Rehm Thermal Systems.
4. Sales Growth
Examining a company’s long-term performance can provide clues about its quality. Even a bad business can shine for one or two quarters, but a top-tier one grows for years. Regrettably, Amtech’s sales grew at a sluggish 3.5% compounded annual growth rate over the last five years. This was below our standard for the semiconductor sector and is a rough starting point for our analysis. Semiconductors are a cyclical industry, and long-term investors should be prepared for periods of high growth followed by periods of revenue contractions.

We at StockStory place the most emphasis on long-term growth, but within semiconductors, a half-decade historical view may miss new demand cycles or industry trends like AI. Amtech’s performance shows it grew in the past but relinquished its gains over the last two years, as its revenue fell by 7.9% annually. 
This quarter, Amtech missed Wall Street’s estimates and reported a rather uninspiring 38.7% year-on-year revenue decline, generating $15.6 million of revenue. Adding to the miss, the drop in sales could mean that the current downcycle is deepening. Company management is currently guiding for a 34.6% year-on-year decline in sales next quarter.
We also like to judge companies based on their projected revenue growth, but not enough Wall Street analysts cover the company for it to have reliable consensus estimates.
5. Product Demand & Outstanding Inventory
Days Inventory Outstanding (DIO) is an important metric for chipmakers, as it reflects a business’ capital intensity and the cyclical nature of semiconductor supply and demand. In a tight supply environment, inventories tend to be stable, allowing chipmakers to exert pricing power. Steadily increasing DIO can be a warning sign that demand is weak, and if inventories continue to rise, the company may have to downsize production.
This quarter, Amtech’s DIO came in at 119, which is 35 days below its five-year average. At the moment, these numbers show no indication of an excessive inventory buildup.

6. Gross Margin & Pricing Power
In the semiconductor industry, a company’s gross profit margin is a critical metric to track because it sheds light on its pricing power, complexity of products, and ability to procure raw materials, equipment, and labor.
Amtech’s gross margin is one of the worst in the semiconductor industry, signaling it operates in a competitive market and lacks pricing power. As you can see below, it averaged a 32.3% gross margin over the last two years. Said differently, Amtech had to pay a chunky $67.66 to its suppliers for every $100 in revenue. 
Amtech’s gross profit margin was negative 2% this quarter. Amtech’s full-year margin has also been trending down over the past 12 months, decreasing by 1.5 percentage points. If this move continues, it could suggest a more competitive environment with some pressure to lower prices and higher input costs (such as raw materials and manufacturing expenses).
7. Operating Margin
Operating margin is one of the best measures of profitability because it tells us how much money a company takes home after procuring and manufacturing its products, marketing and selling those products, and most importantly, keeping them relevant through research and development.
Amtech’s high expenses have contributed to an average operating margin of negative 19.7% over the last two years. Unprofitable semiconductor companies require extra attention because they could get caught swimming naked when the tide goes out. It’s hard to trust that the business can endure a full cycle.
Analyzing the trend in its profitability, Amtech’s operating margin decreased by 33.7 percentage points over the last five years. This raises questions about the company’s expense base because its revenue growth should have given it leverage on its fixed costs, resulting in better economies of scale and profitability. Amtech’s performance was poor no matter how you look at it - it shows that costs were rising and it couldn’t pass them onto its customers.
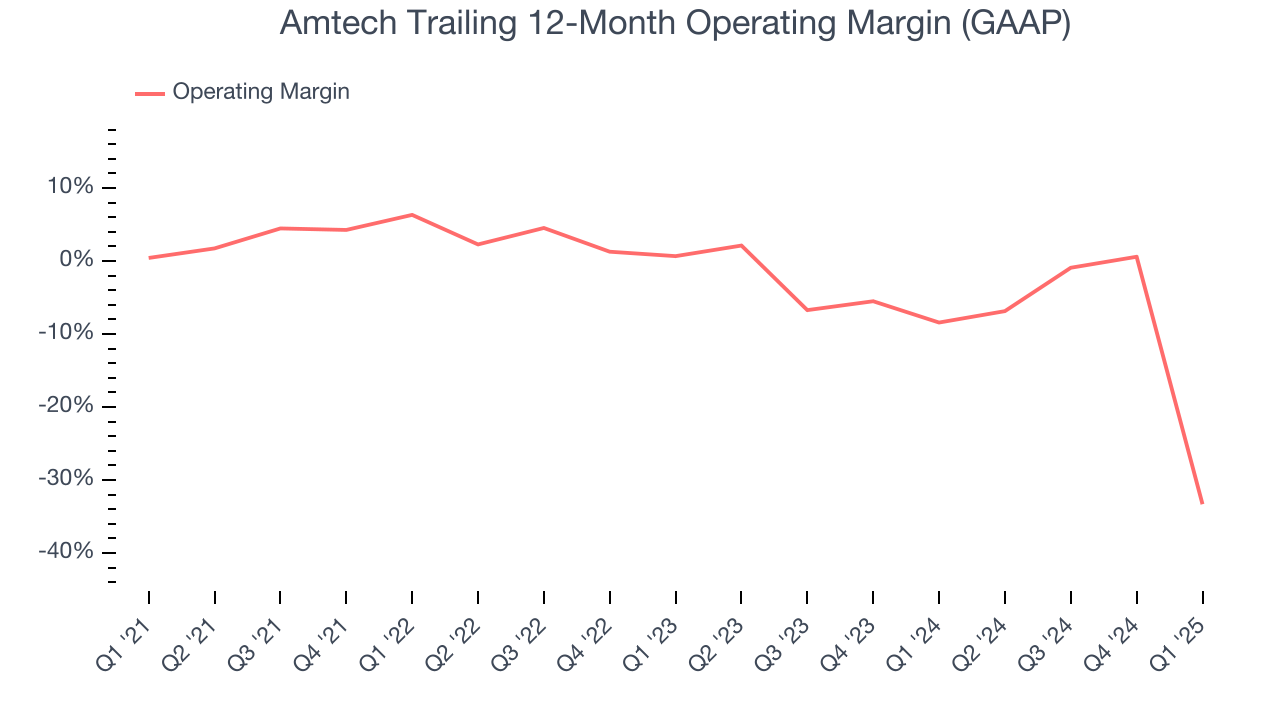
Amtech’s operating margin was negative 202% this quarter. The company's consistent lack of profits raise a flag.
8. Earnings Per Share
We track the long-term change in earnings per share (EPS) for the same reason as long-term revenue growth. Compared to revenue, however, EPS highlights whether a company’s growth is profitable.
Sadly for Amtech, its EPS declined by 16% annually over the last five years while its revenue grew by 3.5%. This tells us the company became less profitable on a per-share basis as it expanded.

Diving into the nuances of Amtech’s earnings can give us a better understanding of its performance. As we mentioned earlier, Amtech’s operating margin declined by 33.7 percentage points over the last five years. Its share count also grew by 1%, meaning the company not only became less efficient with its operating expenses but also diluted its shareholders. 
In Q1, Amtech reported EPS at negative $0.16, down from negative $0.01 in the same quarter last year. This print missed analysts’ estimates. We also like to analyze expected EPS growth based on Wall Street analysts’ consensus projections, but there is insufficient data.
9. Cash Is King
Although earnings are undoubtedly valuable for assessing company performance, we believe cash is king because you can’t use accounting profits to pay the bills.
Amtech has shown poor cash profitability over the last two years, giving the company limited opportunities to return capital to shareholders. Its free cash flow margin averaged 3.2%, lousy for a semiconductor business.
Taking a step back, an encouraging sign is that Amtech’s margin expanded by 16.8 percentage points over the last five years. The company’s improvement shows it’s heading in the right direction, and we can see it became a less capital-intensive business because its free cash flow profitability rose while its operating profitability fell.

Amtech’s free cash flow clocked in at $2.93 million in Q1, equivalent to a 18.8% margin. Its cash flow turned positive after being negative in the same quarter last year, building on its favorable historical trend.
10. Return on Invested Capital (ROIC)
EPS and free cash flow tell us whether a company was profitable while growing its revenue. But was it capital-efficient? A company’s ROIC explains this by showing how much operating profit it makes compared to the money it has raised (debt and equity).
Amtech’s five-year average ROIC was negative 0.2%, meaning management lost money while trying to expand the business. Its returns were among the worst in the semiconductor sector.

11. Balance Sheet Assessment
Amtech reported $13.43 million of cash and $16.52 million of debt on its balance sheet in the most recent quarter. As investors in high-quality companies, we primarily focus on two things: 1) that a company’s debt level isn’t too high and 2) that its interest payments are not excessively burdening the business.

With $3.49 million of EBITDA over the last 12 months, we view Amtech’s 0.9× net-debt-to-EBITDA ratio as safe. We also see its $123,000 of annual interest expenses as appropriate. The company’s profits give it plenty of breathing room, allowing it to continue investing in growth initiatives.
12. Key Takeaways from Amtech’s Q1 Results
We were impressed by Amtech’s strong improvement in inventory levels. On the other hand, its revenue guidance for next quarter missed significantly and its revenue fell short of Wall Street’s estimates. Overall, this was a softer quarter. The stock traded down 3.3% to $3.25 immediately following the results.
13. Is Now The Time To Buy Amtech?
Updated: June 14, 2025 at 10:25 PM EDT
Before investing in or passing on Amtech, we urge you to understand the company’s business quality (or lack thereof), valuation, and the latest quarterly results - in that order.
We see the value of companies furthering technological innovation, but in the case of Amtech, we’re out. First off, its revenue growth was weak over the last five years. And while its rising cash profitability gives it more optionality, the downside is its relatively low ROIC suggests management has struggled to find compelling investment opportunities. On top of that, its operating margins reveal poor profitability compared to other semiconductor companies.
Amtech’s EV-to-EBITDA ratio based on the next 12 months is 15.2x. This valuation tells us a lot of optimism is priced in - we think there are better opportunities elsewhere.
Wall Street analysts have a consensus one-year price target of $6 on the company (compared to the current share price of $4.02).
Although the price target is bullish, readers should exercise caution because analysts tend to be overly optimistic. The firms they work for, often big banks, have relationships with companies that extend into fundraising, M&A advisory, and other rewarding business lines. As a result, they typically hesitate to say bad things for fear they will lose out. We at StockStory do not suffer from such conflicts of interest, so we’ll always tell it like it is.