
CooperCompanies (COO)
CooperCompanies doesn’t excite us. Its weak returns on capital suggest it doesn’t generate sufficient profits, a sign of value destruction.― StockStory Analyst Team
1. News


2. Summary
Why CooperCompanies Is Not Exciting
With a history dating back to 1958 and a portfolio spanning two distinct healthcare segments, Cooper Companies (NASDAQ:COO) develops and manufactures medical devices focused on vision care through contact lenses and women's health including fertility products and services.
- Below-average returns on capital indicate management struggled to find compelling investment opportunities
- On the plus side, its excellent adjusted operating margin highlights the strength of its business model


CooperCompanies falls short of our expectations. Our attention is focused on better businesses.
Why There Are Better Opportunities Than CooperCompanies


CooperCompanies is trading at $67.40 per share, or 16x forward P/E. CooperCompanies’s multiple may seem like a great deal among healthcare peers, but we think there are valid reasons why it’s this cheap.
Cheap stocks can look like great bargains at first glance, but you often get what you pay for. These mediocre businesses often have less earnings power, meaning there is more reliance on a re-rating to generate good returns - an unlikely scenario for low-quality companies.
3. CooperCompanies (COO) Research Report: Q1 CY2025 Update
Medical device company CooperCompanies (NASDAQ:COO) reported Q1 CY2025 results beating Wall Street’s revenue expectations, with sales up 6.3% year on year to $1 billion. The company expects the full year’s revenue to be around $4.13 billion, close to analysts’ estimates. Its non-GAAP profit of $0.96 per share was 3.3% above analysts’ consensus estimates.
CooperCompanies (COO) Q1 CY2025 Highlights:
- Revenue: $1 billion vs analyst estimates of $994.1 million (6.3% year-on-year growth, 0.8% beat)
- Adjusted EPS: $0.96 vs analyst estimates of $0.93 (3.3% beat)
- The company slightly lifted its revenue guidance for the full year to $4.13 billion at the midpoint from $4.12 billion
- Management raised its full-year Adjusted EPS guidance to $4.08 at the midpoint, a 2.5% increase
- Operating Margin: 18.4%, up from 17.2% in the same quarter last year
- Organic Revenue rose 7% year on year (8.5% in the same quarter last year)
- Market Capitalization: $16.02 billion
Company Overview
With a history dating back to 1958 and a portfolio spanning two distinct healthcare segments, Cooper Companies (NASDAQ:COO) develops and manufactures medical devices focused on vision care through contact lenses and women's health including fertility products and services.
Cooper operates through two primary business segments: CooperVision and CooperSurgical. CooperVision is a global manufacturer of contact lenses, offering products in various modalities including single-use and frequent replacement lenses. The division produces spherical lenses for basic vision correction as well as specialized lenses for more complex conditions like astigmatism and presbyopia. Its flagship brands include Biofinity, MyDay, and clariti 1 day. CooperVision also markets MiSight, the first FDA-approved contact lens designed to slow myopia progression in children.
CooperSurgical focuses on fertility and women's health products and services. This division offers medical devices used in gynecology and obstetrics, fertility treatments, and contraception. Its product portfolio includes tools for in vitro fertilization (IVF), micro-tools for embryologists, and laboratory equipment for fertility clinics. CooperSurgical also provides services like donor gamete programs, cryostorage for reproductive tissues, and genetic testing. The division markets Paragard, a hormone-free copper intrauterine device (IUD) that prevents pregnancy for up to ten years.
A healthcare provider might use CooperVision's toric lenses to help a patient with astigmatism achieve clearer vision, or a fertility specialist might utilize CooperSurgical's embryo culture media and incubators during an IVF procedure to optimize conditions for embryo development.
Cooper generates revenue through direct sales to eye care professionals, hospitals, surgery centers, and fertility clinics. The company also sells through distributors and retail chains in certain markets. Cooper maintains manufacturing facilities across multiple countries including the United States, United Kingdom, Costa Rica, and Hungary, allowing it to serve customers globally while maintaining regional expertise.
4. Medical Devices & Supplies - Diversified
The medical devices industry operates a business model that balances steady demand with significant investments in innovation and regulatory compliance. The industry benefits from recurring revenue streams tied to consumables, maintenance services, and incremental upgrades to the latest technologies. However, the capital-intensive nature of product development, coupled with lengthy regulatory pathways and the need for clinical validation, can weigh on profitability and timelines. In addition, there are constant pricing pressures from healthcare systems and insurers maximizing cost efficiency. Over the next several years, one tailwind is demographic–aging populations means rising chronic disease rates that drive greater demand for medical interventions and monitoring solutions. Advances in digital health, such as remote patient monitoring and smart devices, are also expected to unlock new demand by shortening upgrade cycles. On the other hand, the industry faces headwinds from pricing and reimbursement pressures as healthcare providers increasingly adopt value-based care models. Additionally, the integration of cybersecurity for connected devices adds further risk and complexity for device manufacturers.
Cooper Companies' vision care segment, CooperVision, competes primarily with Johnson & Johnson Vision Care, Alcon Inc., and Bausch + Lomb in the contact lens market. In the women's health and fertility segment, CooperSurgical faces competition from Vitrolife Group, FujiFilm-Irvine Scientific, and Hamilton Thorne, as well as larger medical device companies like Johnson & Johnson, Medtronic, and Hologic.
5. Economies of Scale
Larger companies benefit from economies of scale, where fixed costs like infrastructure, technology, and administration are spread over a higher volume of goods or services, reducing the cost per unit. Scale can also lead to bargaining power with suppliers, greater brand recognition, and more investment firepower. A virtuous cycle can ensue if a scaled company plays its cards right.
With $3.99 billion in revenue over the past 12 months, CooperCompanies has decent scale. This is important as it gives the company more leverage in a heavily regulated, competitive environment that is complex and resource-intensive.
6. Sales Growth
Examining a company’s long-term performance can provide clues about its quality. Any business can experience short-term success, but top-performing ones enjoy sustained growth for years. Luckily, CooperCompanies’s sales grew at a decent 9.4% compounded annual growth rate over the last five years. Its growth was slightly above the average healthcare company and shows its offerings resonate with customers.

We at StockStory place the most emphasis on long-term growth, but within healthcare, a half-decade historical view may miss recent innovations or disruptive industry trends. CooperCompanies’s annualized revenue growth of 7.9% over the last two years is below its five-year trend, but we still think the results were respectable. 
CooperCompanies also reports organic revenue, which strips out one-time events like acquisitions and currency fluctuations that don’t accurately reflect its fundamentals. Over the last two years, CooperCompanies’s organic revenue averaged 8% year-on-year growth. Because this number aligns with its normal revenue growth, we can see the company’s core operations (not acquisitions and divestitures) drove most of its results. 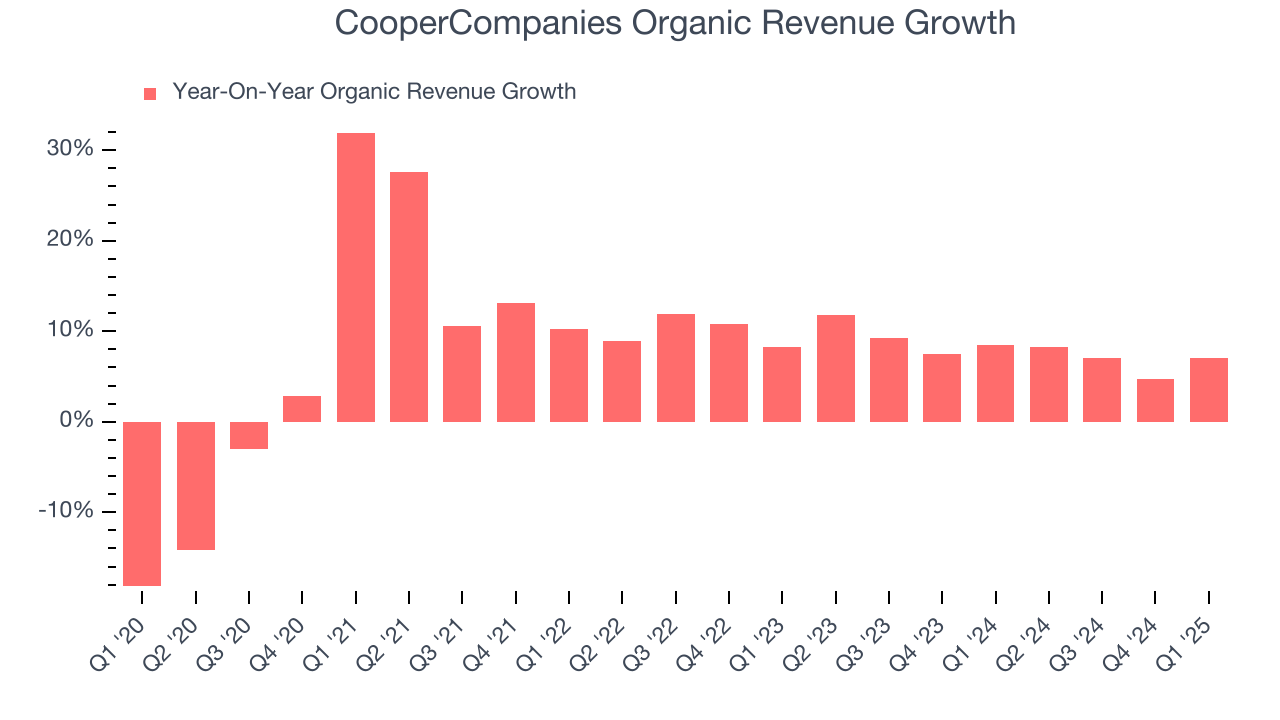
This quarter, CooperCompanies reported year-on-year revenue growth of 6.3%, and its $1 billion of revenue exceeded Wall Street’s estimates by 0.8%.
Looking ahead, sell-side analysts expect revenue to grow 6.5% over the next 12 months, similar to its two-year rate. Despite the slowdown, this projection is above the sector average and suggests the market is baking in some success for its newer products and services.
7. Operating Margin
CooperCompanies has managed its cost base well over the last five years. It demonstrated solid profitability for a healthcare business, producing an average operating margin of 16.5%.
Analyzing the trend in its profitability, CooperCompanies’s operating margin rose by 2.1 percentage points over the last five years, as its sales growth gave it operating leverage. This performance was mostly driven by its recent improvements as the company’s margin has increased by 4.7 percentage points on a two-year basis.

This quarter, CooperCompanies generated an operating margin profit margin of 18.4%, up 1.3 percentage points year on year. This increase was a welcome development and shows it was more efficient.
8. Earnings Per Share
Revenue trends explain a company’s historical growth, but the long-term change in earnings per share (EPS) points to the profitability of that growth – for example, a company could inflate its sales through excessive spending on advertising and promotions.
CooperCompanies’s EPS grew at a solid 7.7% compounded annual growth rate over the last five years. Despite its operating margin expansion during that time, this performance was lower than its 9.4% annualized revenue growth, telling us that non-fundamental factors such as interest and taxes affected its ultimate earnings.

We can take a deeper look into CooperCompanies’s earnings to better understand the drivers of its performance. A five-year view shows CooperCompanies has diluted its shareholders, growing its share count by 1.2%. This dilution overshadowed its increased operating efficiency and has led to lower per share earnings. Taxes and interest expenses can also affect EPS but don’t tell us as much about a company’s fundamentals. 
In Q1, CooperCompanies reported EPS at $0.96, up from $0.85 in the same quarter last year. This print beat analysts’ estimates by 3.3%. Over the next 12 months, Wall Street expects CooperCompanies’s full-year EPS of $3.88 to grow 8.2%.
9. Cash Is King
Although earnings are undoubtedly valuable for assessing company performance, we believe cash is king because you can’t use accounting profits to pay the bills.
CooperCompanies has shown impressive cash profitability, giving it the option to reinvest or return capital to investors. The company’s free cash flow margin averaged 11% over the last five years, better than the broader healthcare sector.
Taking a step back, we can see that CooperCompanies’s margin dropped by 2.3 percentage points during that time. If its declines continue, it could signal increasing investment needs and capital intensity.

10. Return on Invested Capital (ROIC)
EPS and free cash flow tell us whether a company was profitable while growing its revenue. But was it capital-efficient? Enter ROIC, a metric showing how much operating profit a company generates relative to the money it has raised (debt and equity).
CooperCompanies historically did a mediocre job investing in profitable growth initiatives. Its five-year average ROIC was 5.1%, somewhat low compared to the best healthcare companies that consistently pump out 20%+.

We like to invest in businesses with high returns, but the trend in a company’s ROIC is what often surprises the market and moves the stock price. Unfortunately, CooperCompanies’s ROIC has stayed the same over the last few years. If the company wants to become an investable business, it must improve its returns by generating more profitable growth.
11. Balance Sheet Assessment
CooperCompanies reported $116.2 million of cash and $2.59 billion of debt on its balance sheet in the most recent quarter. As investors in high-quality companies, we primarily focus on two things: 1) that a company’s debt level isn’t too high and 2) that its interest payments are not excessively burdening the business.
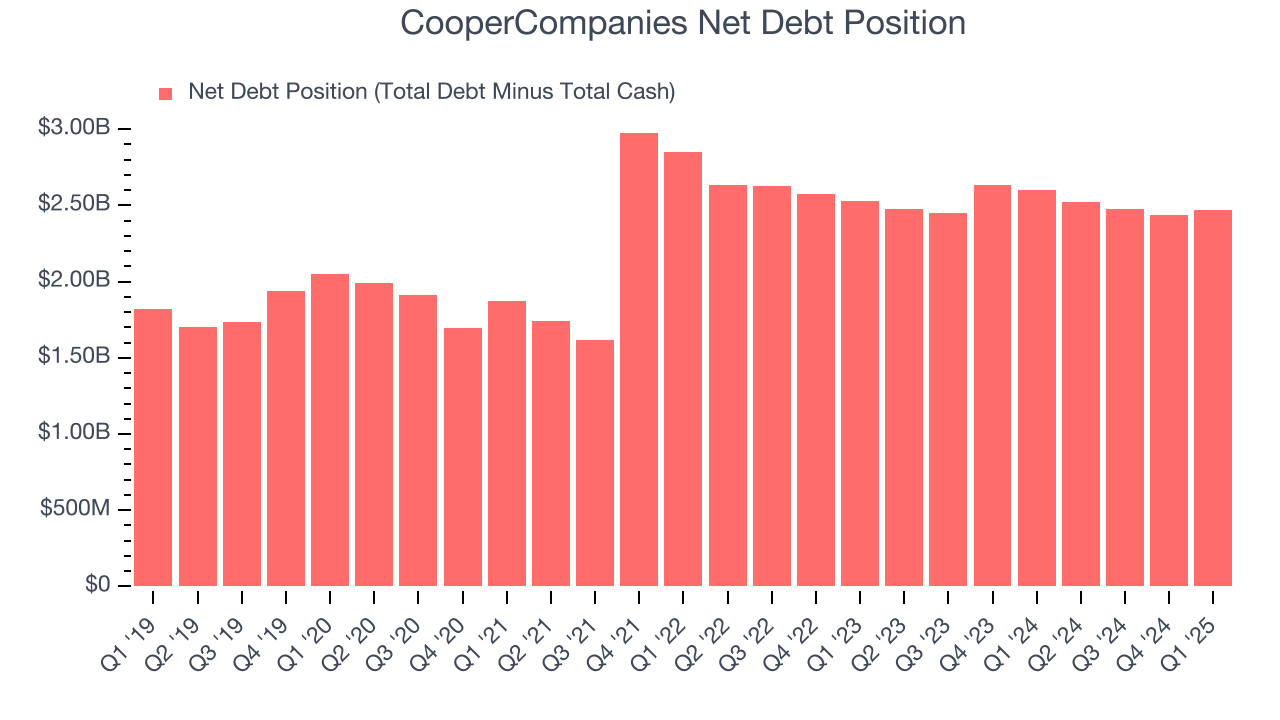
With $1.18 billion of EBITDA over the last 12 months, we view CooperCompanies’s 2.1× net-debt-to-EBITDA ratio as safe. We also see its $57.3 million of annual interest expenses as appropriate. The company’s profits give it plenty of breathing room, allowing it to continue investing in growth initiatives.
12. Key Takeaways from CooperCompanies’s Q1 Results
It was encouraging to see CooperCompanies raise its full-year revenue and EPS guidance. We were also happy its organic revenue and EPS outperformed Wall Street’s estimates. Overall, this print had some key positives. Investors were likely hoping for more, and shares traded down 4% to $76.81 immediately following the results.
13. Is Now The Time To Buy CooperCompanies?
Updated: June 2, 2025 at 11:48 PM EDT
Before making an investment decision, investors should account for CooperCompanies’s business fundamentals and valuation in addition to what happened in the latest quarter.
CooperCompanies isn’t a terrible business, but it doesn’t pass our bar. Although its revenue growth was decent over the last five years, it’s expected to deteriorate over the next 12 months and its cash profitability fell over the last five years. And while the company’s strong operating margins show it’s a well-run business, the downside is its mediocre ROIC lags the market and is a headwind for its stock price.
CooperCompanies’s P/E ratio based on the next 12 months is 16x. Beauty is in the eye of the beholder, but our analysis shows the upside isn’t great compared to the potential downside. We're fairly confident there are better investments elsewhere.
Wall Street analysts have a consensus one-year price target of $95.85 on the company (compared to the current share price of $67.40).
Although the price target is bullish, readers should exercise caution because analysts tend to be overly optimistic. The firms they work for, often big banks, have relationships with companies that extend into fundraising, M&A advisory, and other rewarding business lines. As a result, they typically hesitate to say bad things for fear they will lose out. We at StockStory do not suffer from such conflicts of interest, so we’ll always tell it like it is.
Enjoyed this research report? Then you will absolutely love StockStory Edge.
StockStory Edge provides you with in-depth research on more than 1,100 stocks including many that fly under-the-radar, helping you understand not only what to buy but also what to avoid.
Did you know that StockStory High Quality stocks generated a market-beating return of 183% from March 31, 2020 to March 31, 2025 vs an 117% return for the market? We achieve this outperformance by blending AI-powered analysis with the experitize of our analysts to identify opportunities overlooked by the market.