
Disney (DIS)
We wouldn’t recommend Disney. Its sales have underperformed and its low returns on capital show it has few growth opportunities.― StockStory Analyst Team
1. News


2. Summary
Why We Think Disney Will Underperform
Founded by brothers Walt and Roy, Disney (NYSE:DIS) is a multinational entertainment conglomerate, renowned for its theme parks, movies, television networks, and merchandise.
- Below-average returns on capital indicate management struggled to find compelling investment opportunities
- Annual sales growth of 3.7% over the last five years lagged behind its consumer discretionary peers as its large revenue base made it difficult to generate incremental demand
- Demand will likely be soft over the next 12 months as Wall Street’s estimates imply tepid growth of 3.7%


Disney fails to meet our quality criteria. There are more promising prospects in the market.
Why There Are Better Opportunities Than Disney


Disney is trading at $117.61 per share, or 21.3x forward P/E. Not only is Disney’s multiple richer than most consumer discretionary peers, but it’s also expensive for its revenue characteristics.
We prefer to invest in similarly-priced but higher-quality companies with superior earnings growth.
3. Disney (DIS) Research Report: Q1 CY2025 Update
Global entertainment and media company Disney (NYSE:DIS) reported Q1 CY2025 results exceeding the market’s revenue expectations, with sales up 7% year on year to $23.62 billion. Its non-GAAP profit of $1.45 per share was 19.8% above analysts’ consensus estimates.
Disney (DIS) Q1 CY2025 Highlights:
- Revenue: $23.62 billion vs analyst estimates of $23.17 billion (7% year-on-year growth, 2% beat)
- Adjusted EPS: $1.45 vs analyst estimates of $1.21 (19.8% beat)
- Disney+ Subscribers: 126 million vs analyst estimates of 123.35 million (beat, surprising net adds with Street expecting decline)
- 2025 Adjusted EPS Guidance: $5.75 vs analyst estimates of $5.44 (5.7% beat)
- Operating Margin: 18.8%, up from 13.7% in the same quarter last year
- Free Cash Flow Margin: 20.7%, up from 10.9% in the same quarter last year
- Market Capitalization: $166.6 billion
Company Overview
Founded by brothers Walt and Roy, Disney (NYSE:DIS) is a multinational entertainment conglomerate, renowned for its theme parks, movies, television networks, and merchandise.
When it was founded in 1923, the Disney brothers' key focus was on animation, and the company gained wide acclaim for 'Steamboat Willie', an animated short film that was innovative for its time. In addition to that groundbreaking film, Disney created iconic characters such as Mickey Mouse, Donald Duck, and Pluto, paving the way for the company to move from animation to broader family entertainment.
Today, Disney's business encompasses areas such as traditional TV networks such as ABC and ESPN, theme parks and resorts, film production and distribution, streaming services, and consumer products such as toys. Because of these diverse business lines, Disney's presence is nearly ubiquitous to Americans and even the international consumer. The company therefore counts a wide range of ages and demographics as customers. Everyone from that toddler watching 'Frozen' for the 306th time on Disney+ to the avid sports fan who depends on ESPN to stay up on sports scores to the family visiting Disney World is a customer.
Disney's products and offerings are diverse, so it follows that how the company makes money is diverse as well. Some sources of revenue include tickets for theme parks, monthly subscriptions for Disney+, and toys. Other less-obvious revenue sources include advertising on its television networks and affiliate/retransmission fees from companies that carry its channels.
4. Media
The advent of the internet changed how shows, films, music, and overall information flow. As a result, many media companies now face secular headwinds as attention shifts online. Some have made concerted efforts to adapt by introducing digital subscriptions, podcasts, and streaming platforms. Time will tell if their strategies succeed and which companies will emerge as the long-term winners.
Competitors in the entertainment and media industry include Comcast (NASDAQ:CMCSA), Warner Bros. Discovery (NASDAQ:WBD), and Paramount Global (NASDAQ:PARA).
5. Sales Growth
Reviewing a company’s long-term sales performance reveals insights into its quality. Any business can have short-term success, but a top-tier one grows for years. Unfortunately, Disney’s 3.7% annualized revenue growth over the last five years was sluggish. This was below our standard for the consumer discretionary sector and is a poor baseline for our analysis.

We at StockStory place the most emphasis on long-term growth, but within consumer discretionary, a stretched historical view may miss a company riding a successful new product or trend. Disney’s annualized revenue growth of 4% over the last two years aligns with its five-year trend, suggesting its demand was consistently weak. 
Disney also breaks out the revenue for its three most important segments: Entertainment, Sports, and Experiences, which are 45.2%, 19.2%, and 37.6% of revenue. Over the last two years, Disney’s revenues in all three segments increased. Its Entertainment revenue (movies, Disney+) averaged year-on-year growth of 3.5% while its Sports (ESPN, SEC Network) and Experiences (theme parks) revenues averaged 1.8% and 6.8%.
This quarter, Disney reported year-on-year revenue growth of 7%, and its $23.62 billion of revenue exceeded Wall Street’s estimates by 2%.
Looking ahead, sell-side analysts expect revenue to grow 3.3% over the next 12 months, similar to its two-year rate. This projection doesn't excite us and suggests its newer products and services will not catalyze better top-line performance yet.
6. Operating Margin
Operating margin is a key measure of profitability. Think of it as net income - the bottom line - excluding the impact of taxes and interest on debt, which are less connected to business fundamentals.
Disney’s operating margin has risen over the last 12 months and averaged 14.7% over the last two years. Its solid profitability for a consumer discretionary business shows it’s an efficient company that manages its expenses effectively.

This quarter, Disney generated an operating profit margin of 18.8%, up 5.1 percentage points year on year. This increase was a welcome development and shows it was more efficient.
7. Earnings Per Share
We track the long-term change in earnings per share (EPS) for the same reason as long-term revenue growth. Compared to revenue, however, EPS highlights whether a company’s growth is profitable.
Disney’s unimpressive 4.5% annual EPS growth over the last five years aligns with its revenue performance. On the bright side, this tells us its incremental sales were profitable.
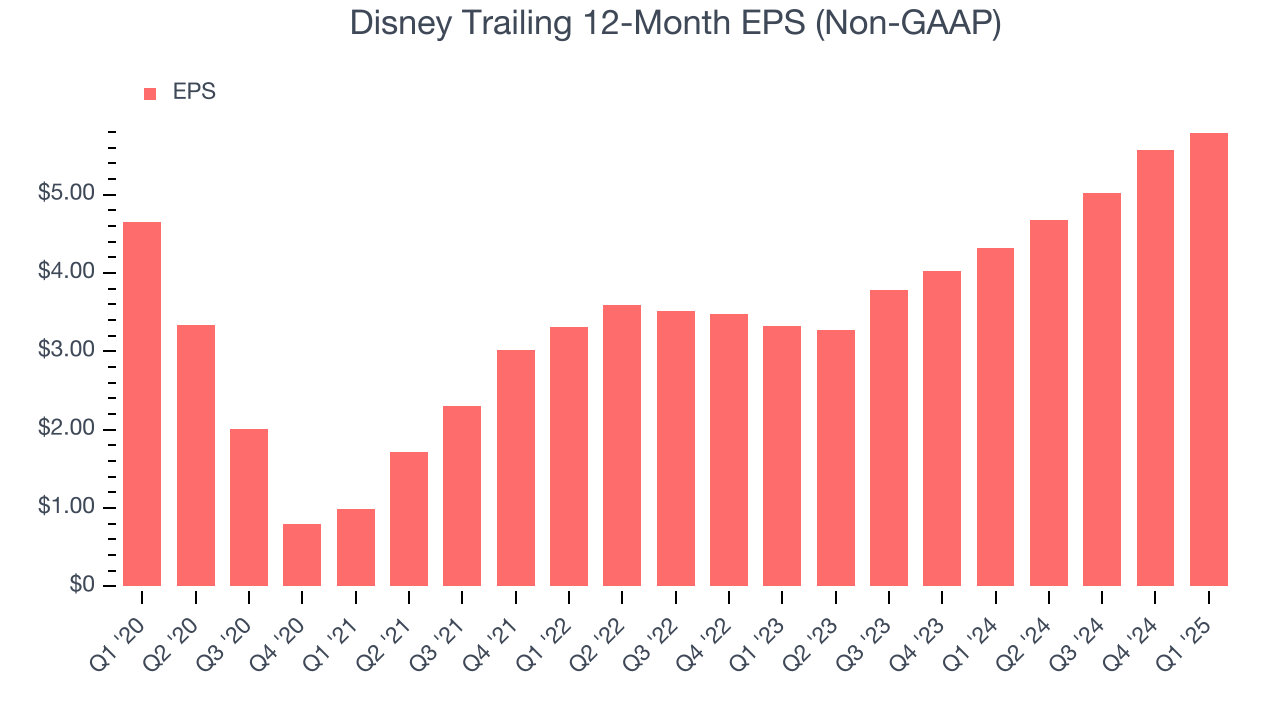
In Q1, Disney reported EPS at $1.45, up from $1.22 in the same quarter last year. This print easily cleared analysts’ estimates, and shareholders should be content with the results. Over the next 12 months, Wall Street expects Disney’s full-year EPS of $5.79 to shrink by 4.6%.
8. Cash Is King
Free cash flow isn't a prominently featured metric in company financials and earnings releases, but we think it's telling because it accounts for all operating and capital expenses, making it tough to manipulate. Cash is king.
Disney has shown decent cash profitability, giving it some flexibility to reinvest or return capital to investors. The company’s free cash flow margin averaged 10.5% over the last two years, slightly better than the broader consumer discretionary sector.

Disney’s free cash flow clocked in at $4.89 billion in Q1, equivalent to a 20.7% margin. This result was good as its margin was 9.8 percentage points higher than in the same quarter last year, but we wouldn’t read too much into the short term because investment needs can be seasonal, leading to temporary swings. Long-term trends trump fluctuations.
Over the next year, analysts predict Disney’s cash conversion will fall. Their consensus estimates imply its free cash flow margin of 11.6% for the last 12 months will decrease to 6.4%.
9. Return on Invested Capital (ROIC)
EPS and free cash flow tell us whether a company was profitable while growing its revenue. But was it capital-efficient? Enter ROIC, a metric showing how much operating profit a company generates relative to the money it has raised (debt and equity).
Disney historically did a mediocre job investing in profitable growth initiatives. Its five-year average ROIC was 5.7%, somewhat low compared to the best consumer discretionary companies that consistently pump out 25%+.
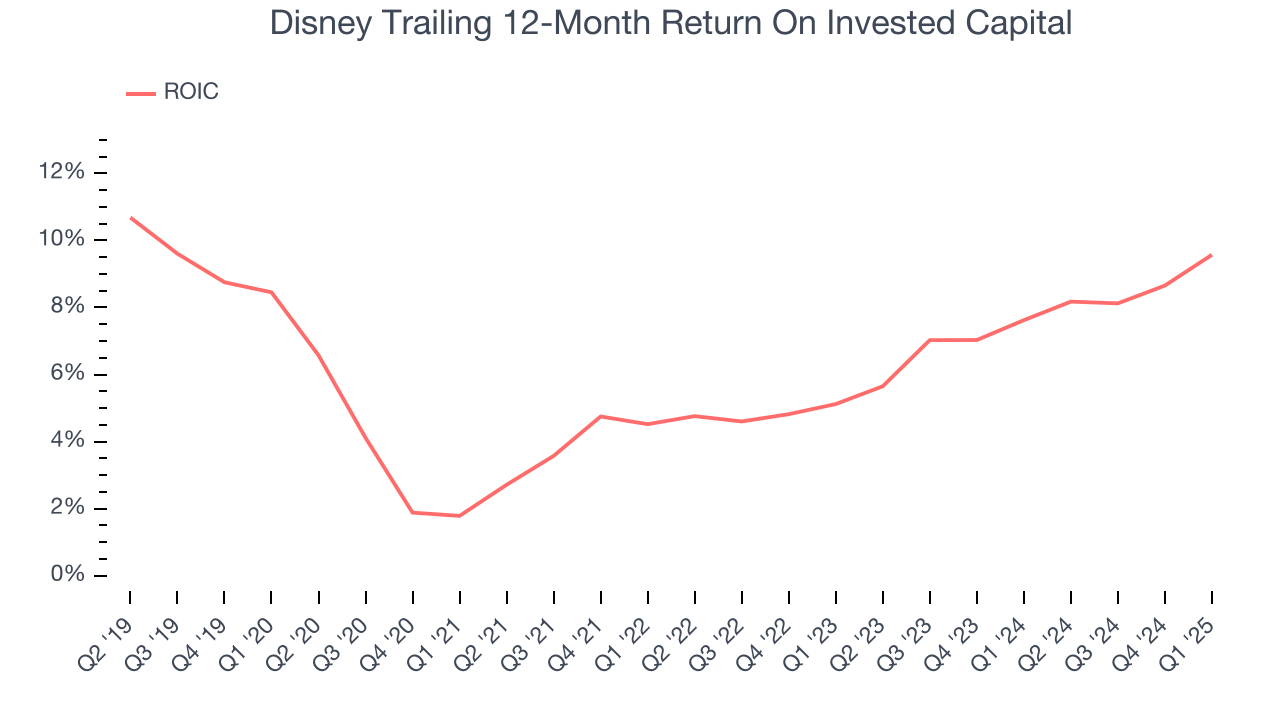
We like to invest in businesses with high returns, but the trend in a company’s ROIC is what often surprises the market and moves the stock price. Fortunately, Disney’s has increased over the last few years. This is a good sign, and we hope the company can continue improving.
10. Balance Sheet Assessment
Disney reported $5.85 billion of cash and $42.89 billion of debt on its balance sheet in the most recent quarter. As investors in high-quality companies, we primarily focus on two things: 1) that a company’s debt level isn’t too high and 2) that its interest payments are not excessively burdening the business.

With $19.6 billion of EBITDA over the last 12 months, we view Disney’s 1.9× net-debt-to-EBITDA ratio as safe. We also see its $1.67 billion of annual interest expenses as appropriate. The company’s profits give it plenty of breathing room, allowing it to continue investing in growth initiatives.
11. Key Takeaways from Disney’s Q1 Results
We enjoyed seeing Disney beat analysts’ revenue and EPS expectations this quarter. We were also impressed that Disney+ net adds were positive and beat Wall Street's estimates. The icing on the cake was full-year adjusted EPS guidance that handily topped expectations. Zooming out, we think this was a very good print. The stock traded up 5.5% to $97.10 immediately following the results.
12. Is Now The Time To Buy Disney?
Updated: June 19, 2025 at 11:03 PM EDT
Before deciding whether to buy Disney or pass, we urge investors to consider business quality, valuation, and the latest quarterly results.
We see the value of companies helping consumers, but in the case of Disney, we’re out. To begin with, its revenue growth was weak over the last five years, and analysts don’t see anything changing over the next 12 months. And while its sturdy operating margins show it has disciplined cost controls, the downside is its Forecasted free cash flow margin suggests the company will ramp up its investments next year. On top of that, its relatively low ROIC suggests management has struggled to find compelling investment opportunities.
Disney’s P/E ratio based on the next 12 months is 21.3x. This multiple tells us a lot of good news is priced in - we think other companies feature superior fundamentals at the moment.
Wall Street analysts have a consensus one-year price target of $124.63 on the company (compared to the current share price of $117.61).