
Silgan Holdings (SLGN)
Silgan Holdings keeps us up at night. Its weak sales growth and low returns on capital show it struggled to generate demand and profits.― StockStory Analyst Team
1. News


2. Summary
Why We Think Silgan Holdings Will Underperform
Established in 1987, Silgan Holdings (NYSE:SLGN) is a supplier of rigid packaging for consumer goods products, specializing in metal containers, closures, and plastic packaging.
- Sales tumbled by 3% annually over the last two years, showing market trends are working against its favor during this cycle
- Falling earnings per share over the last two years has some investors worried as stock prices ultimately follow EPS over the long term
- Organic revenue growth fell short of our benchmarks over the past two years and implies it may need to improve its products, pricing, or go-to-market strategy


Silgan Holdings is in the penalty box. We’d rather invest in businesses with stronger moats.
Why There Are Better Opportunities Than Silgan Holdings


Silgan Holdings’s stock price of $54.88 implies a valuation ratio of 13.2x forward P/E. This multiple is cheaper than most industrials peers, but we think this is justified.
It’s better to pay up for high-quality businesses with higher long-term earnings potential rather than to buy lower-quality stocks because they appear cheap. These challenged businesses often don’t re-rate, a phenomenon known as a “value trap”.
3. Silgan Holdings (SLGN) Research Report: Q1 CY2025 Update
Rigid packaging solutions manufacturer Silgan Holdings (NYSE:SLGN) missed Wall Street’s revenue expectations in Q1 CY2025, but sales rose 11.4% year on year to $1.47 billion. Its non-GAAP profit of $0.82 per share was 4% above analysts’ consensus estimates.
Silgan Holdings (SLGN) Q1 CY2025 Highlights:
- Revenue: $1.47 billion vs analyst estimates of $1.48 billion (11.4% year-on-year growth, 0.7% miss)
- Adjusted EPS: $0.82 vs analyst estimates of $0.79 (4% beat)
- Adjusted EBITDA: $209.9 million vs analyst estimates of $224.6 million (14.3% margin, 6.5% miss)
- Management reiterated its full-year Adjusted EPS guidance of $4.10 at the midpoint
- Operating Margin: 8.9%, in line with the same quarter last year
- Free Cash Flow was -$766.3 million compared to -$668.3 million in the same quarter last year
- Market Capitalization: $5.61 billion
Company Overview
Established in 1987, Silgan Holdings (NYSE:SLGN) is a supplier of rigid packaging for consumer goods products, specializing in metal containers, closures, and plastic packaging.
Founded in 1987 and headquartered in Stamford, Connecticut, Silgan operates through three primary business segments: Dispensing and Specialty Closures, Metal Containers, and Custom Containers.
The Dispensing and Specialty Closures segment, is a worldwide manufacturer of dispensing systems and specialty closures for markets including fragrance and beauty, food, beverage, personal care, home care, and lawn and garden. This segment operates 40+ manufacturing facilities across North America, Europe, Asia, and South America, serving over 100 countries.
The Metal Containers segment is a leading manufacturer of metal containers in North America and Europe. In North America, Silgan claims to be the largest manufacturer of metal food containers with a market share of more than half. This segment operates 40+ manufacturing facilities in the United States, Europe, and Asia, serving over 50 countries.
The Custom Containers segment produces custom-designed plastic containers for markets such as food and beverage, consumer health and pharmaceutical, personal care, home care, and automotive. This segment operates 20+ manufacturing facilities in the United States and Canada.
The company employs various manufacturing processes across its segments, including compression and injection molding for closures, draw and iron or draw and redraw processes for metal containers, and extrusion blowmolding and injection blowmolding for custom containers.
4. Industrial Packaging
Industrial packaging companies have built competitive advantages from economies of scale that lead to advantaged purchasing and capital investments that are difficult and expensive to replicate. Recently, eco-friendly packaging and conservation are driving customers preferences and innovation. For example, plastic is not as desirable a material as it once was. Despite being integral to consumer goods ranging from beer to toothpaste to laundry detergent, these companies are still at the whim of the macro, especially consumer health and consumer willingness to spend.
Competitors in the packaging industry include Crown Holdings (NYSE:CCK), Ardagh Group (NYSE:ARD), and Silgan Holdings (NASDAQ:SLGN)
5. Sales Growth
Examining a company’s long-term performance can provide clues about its quality. Any business can experience short-term success, but top-performing ones enjoy sustained growth for years. Regrettably, Silgan Holdings’s sales grew at a tepid 6% compounded annual growth rate over the last five years. This was below our standard for the industrials sector and is a poor baseline for our analysis.
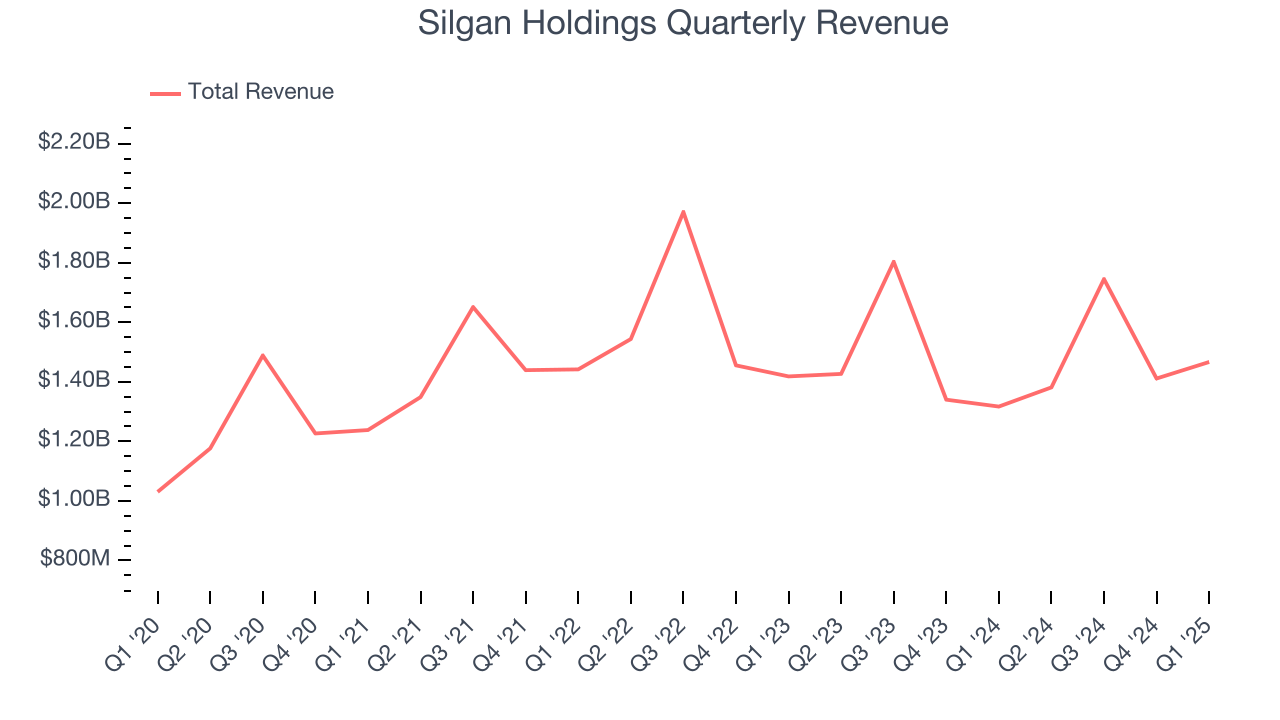
We at StockStory place the most emphasis on long-term growth, but within industrials, a half-decade historical view may miss cycles, industry trends, or a company capitalizing on catalysts such as a new contract win or a successful product line. Silgan Holdings’s performance shows it grew in the past but relinquished its gains over the last two years, as its revenue fell by 3% annually. Silgan Holdings isn’t alone in its struggles as the Industrial Packaging industry experienced a cyclical downturn, with many similar businesses observing lower sales at this time. 
This quarter, Silgan Holdings’s revenue grew by 11.4% year on year to $1.47 billion but fell short of Wall Street’s estimates.
Looking ahead, sell-side analysts expect revenue to grow 7.9% over the next 12 months, an improvement versus the last two years. This projection is above average for the sector and suggests its newer products and services will spur better top-line performance.
6. Gross Margin & Pricing Power
Silgan Holdings has bad unit economics for an industrials business, signaling it operates in a competitive market. As you can see below, it averaged a 16.8% gross margin over the last five years. Said differently, Silgan Holdings had to pay a chunky $83.19 to its suppliers for every $100 in revenue. 
This quarter, Silgan Holdings’s gross profit margin was 18.4%, up 1.5 percentage points year on year. Silgan Holdings’s full-year margin has also been trending up over the past 12 months, increasing by 1 percentage points. If this move continues, it could suggest better unit economics due to more leverage from its growing sales on the fixed portion of its cost of goods sold (such as manufacturing expenses).
7. Operating Margin
Operating margin is an important measure of profitability as it shows the portion of revenue left after accounting for all core expenses – everything from the cost of goods sold to advertising and wages. It’s also useful for comparing profitability across companies with different levels of debt and tax rates because it excludes interest and taxes.
Silgan Holdings has done a decent job managing its cost base over the last five years. The company has produced an average operating margin of 9.7%, higher than the broader industrials sector.
Looking at the trend in its profitability, Silgan Holdings’s operating margin decreased by 1.6 percentage points over the last five years. Many Industrial Packaging companies also saw their margins fall (along with revenue, as mentioned above) because the cycle turned in the wrong direction. We hope Silgan Holdings can emerge from this a stronger company, as the silver lining of a downturn is that market share can be won and efficiencies found.

In Q1, Silgan Holdings generated an operating profit margin of 8.9%, in line with the same quarter last year. This indicates the company’s cost structure has recently been stable.
8. Earnings Per Share
Revenue trends explain a company’s historical growth, but the long-term change in earnings per share (EPS) points to the profitability of that growth – for example, a company could inflate its sales through excessive spending on advertising and promotions.
Silgan Holdings’s EPS grew at a solid 10.7% compounded annual growth rate over the last five years, higher than its 6% annualized revenue growth. However, this alone doesn’t tell us much about its business quality because its operating margin didn’t expand.

We can take a deeper look into Silgan Holdings’s earnings to better understand the drivers of its performance. A five-year view shows that Silgan Holdings has repurchased its stock, shrinking its share count by 3.7%. This tells us its EPS outperformed its revenue not because of increased operational efficiency but financial engineering, as buybacks boost per share earnings. 
Like with revenue, we analyze EPS over a shorter period to see if we are missing a change in the business.
For Silgan Holdings, its two-year annual EPS declines of 3.2% mark a reversal from its (seemingly) healthy five-year trend. We hope Silgan Holdings can return to earnings growth in the future.
In Q1, Silgan Holdings reported EPS at $0.82, up from $0.69 in the same quarter last year. This print beat analysts’ estimates by 4%. Over the next 12 months, Wall Street expects Silgan Holdings’s full-year EPS of $3.76 to grow 10.8%.
9. Cash Is King
Although earnings are undoubtedly valuable for assessing company performance, we believe cash is king because you can’t use accounting profits to pay the bills.
Silgan Holdings has shown poor cash profitability over the last five years, giving the company limited opportunities to return capital to shareholders. Its free cash flow margin averaged 2.4%, lousy for an industrials business.
Taking a step back, we can see that Silgan Holdings failed to improve its margin during that time. Its unexciting margin and trend likely have shareholders hoping for a change.

Silgan Holdings burned through $766.3 million of cash in Q1, equivalent to a negative 52.2% margin. The company’s cash burn increased from $668.3 million of lost cash in the same quarter last year. These numbers deviate from its longer-term margin, indicating it is a seasonal business that must build up inventory during certain quarters.
10. Return on Invested Capital (ROIC)
EPS and free cash flow tell us whether a company was profitable while growing its revenue. But was it capital-efficient? Enter ROIC, a metric showing how much operating profit a company generates relative to the money it has raised (debt and equity).
Silgan Holdings historically did a mediocre job investing in profitable growth initiatives. Its five-year average ROIC was 10%, somewhat low compared to the best industrials companies that consistently pump out 20%+.

We like to invest in businesses with high returns, but the trend in a company’s ROIC is what often surprises the market and moves the stock price. Unfortunately, Silgan Holdings’s ROIC averaged 1.2 percentage point decreases over the last few years. Paired with its already low returns, these declines suggest its profitable growth opportunities are few and far between.
11. Balance Sheet Assessment
Silgan Holdings reported $353 million of cash and $4.63 billion of debt on its balance sheet in the most recent quarter. As investors in high-quality companies, we primarily focus on two things: 1) that a company’s debt level isn’t too high and 2) that its interest payments are not excessively burdening the business.

With $902.7 million of EBITDA over the last 12 months, we view Silgan Holdings’s 4.7× net-debt-to-EBITDA ratio as safe. We also see its $127.7 million of annual interest expenses as appropriate. The company’s profits give it plenty of breathing room, allowing it to continue investing in growth initiatives.
12. Key Takeaways from Silgan Holdings’s Q1 Results
It was encouraging to see Silgan Holdings beat analysts’ EPS expectations this quarter. We were also glad its full-year EPS guidance was in line with Wall Street’s estimates. On the other hand, its EBITDA missed significantly and its revenue fell slightly short of Wall Street’s estimates. Overall, this was a weaker quarter. The stock traded down 1.8% to $51.50 immediately following the results.
13. Is Now The Time To Buy Silgan Holdings?
Updated: May 15, 2025 at 11:35 PM EDT
We think that the latest earnings result is only one piece of the bigger puzzle. If you’re deciding whether to own Silgan Holdings, you should also grasp the company’s longer-term business quality and valuation.
Silgan Holdings falls short of our quality standards. To begin with, its revenue growth was uninspiring over the last five years. And while its solid EPS growth over the last five years shows its profits are trickling down to shareholders, the downside is its organic revenue declined. On top of that, its low gross margins indicate some combination of competitive pressures and high production costs.
Silgan Holdings’s P/E ratio based on the next 12 months is 13.2x. This valuation multiple is fair, but we don’t have much confidence in the company. There are more exciting stocks to buy at the moment.
Wall Street analysts have a consensus one-year price target of $60.24 on the company (compared to the current share price of $54.88).
Want to invest in a High Quality big tech company? We’d point you in the direction of Microsoft and Google, which have durable competitive moats and strong fundamentals, factors that are large determinants of long-term market outperformance.
To get the best start with StockStory, check out our most recent stock picks, and then sign up for our earnings alerts by adding companies to your watchlist. We typically have quarterly earnings results analyzed within seconds of the data being released, giving investors the chance to react before the market has fully absorbed the information. This is especially true for companies reporting pre-market.